Navigation
Theming
See the theme docs
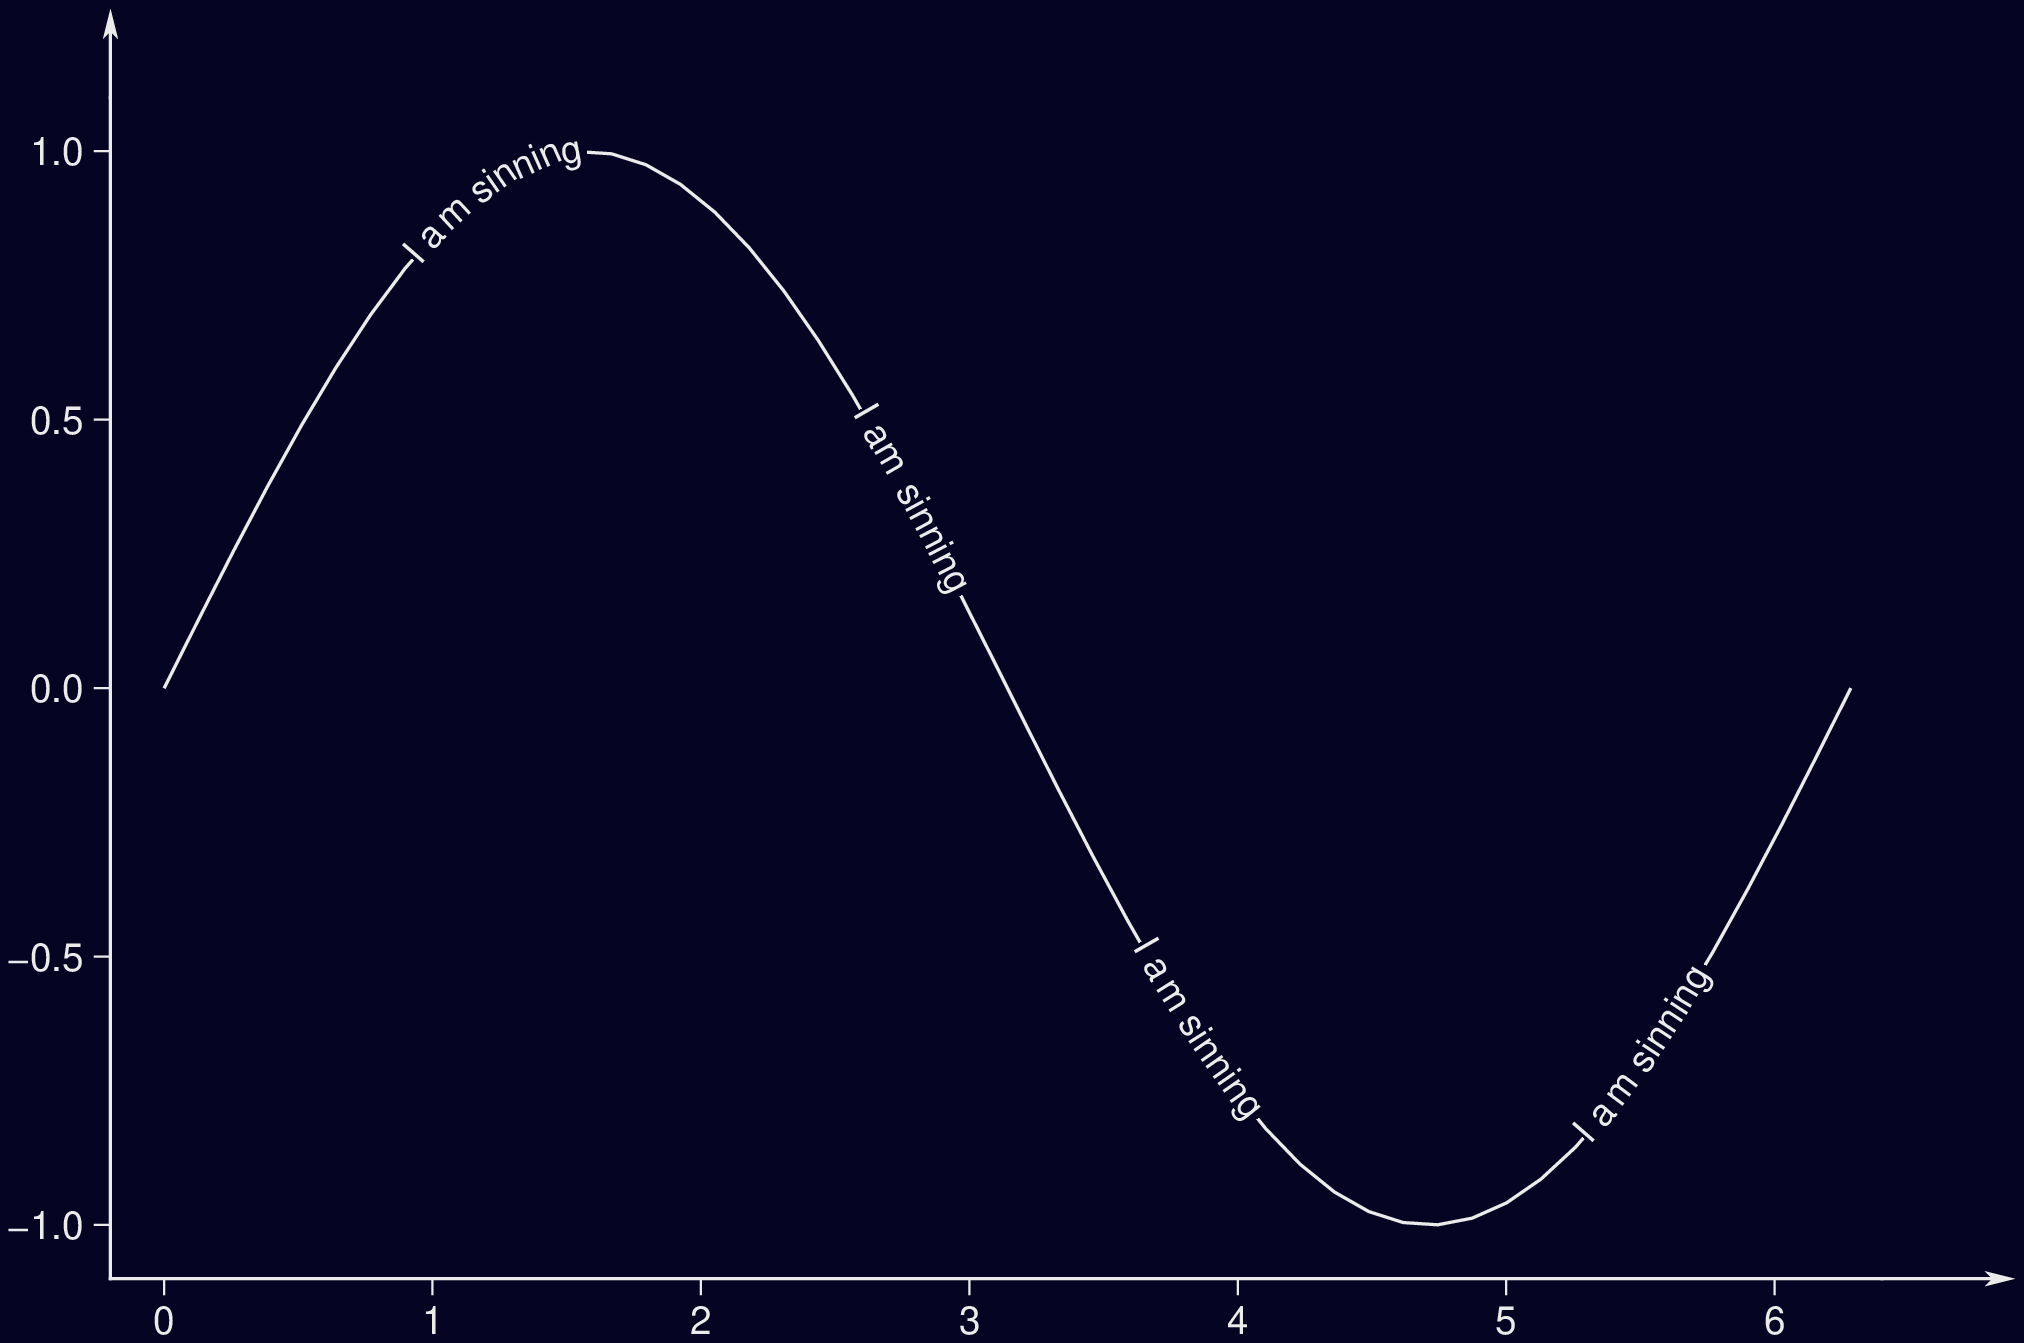
How to sin
using GMT
x = linspace(0,2π,50);
plot(x, sin.(x), linestyle="Line&I am sinning&", theme=("A2GraphDark"), show=true)
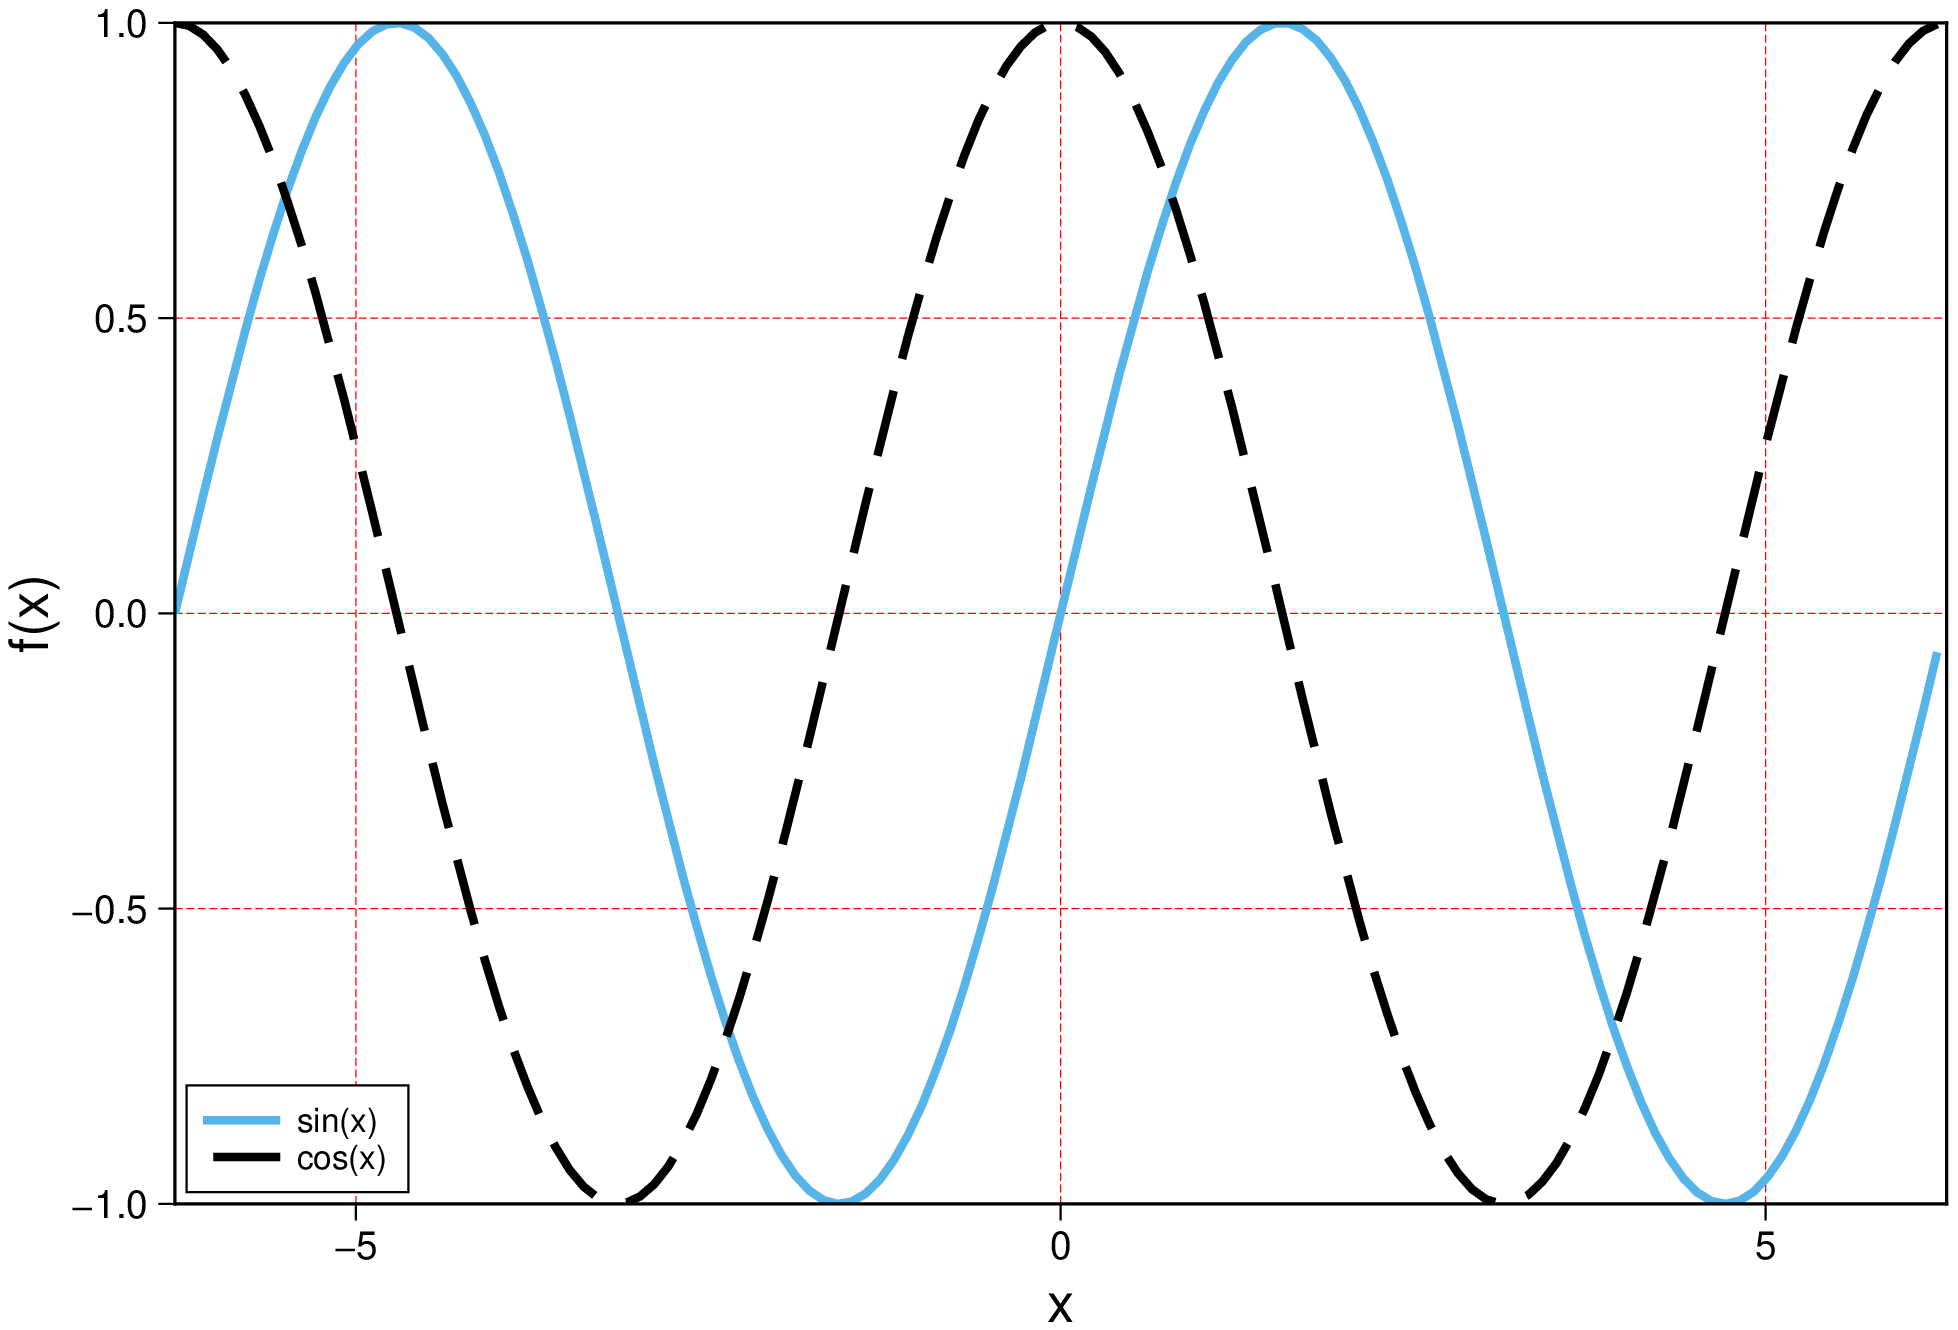
using GMT
x = -2π:0.1:2π
lines(x, sin.(x), limits=(-2π, 2π, -1,1), lc="#56B4E9", lw=2, label="sin(x)",
      xaxis=(label="x",annot=5, grid=5), ylabel="f(x)", grid=(pen=(:red,:dash),), theme=("A2"))
lines!(x, cos.(x), lw=2, linestyle=:dash, legend=(label="cos(x)", pos=:BL), show=true)
© GMT.jl. Last modified: June 07, 2023. Website built with Franklin.jl and the Julia programming language.
These docs were autogenerated using GMT: v1.11.0