Compute anual means from a stack of SST montly means
Create stacks of seasonal averages (anual in this case)
Open the stack of montly SST data created in "Make a stack of L3 MODIS files" Lesson

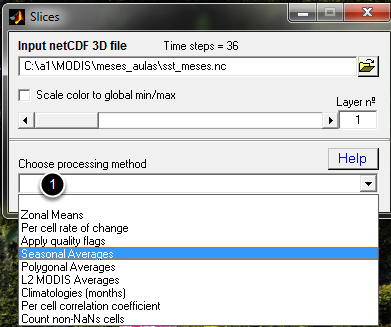
When you open the stack SST monthly file besides the display of the first layer in file, there is also a smaller window to the right that looks like the above. This window let us select the layer to display (using the slider) and to select the processing method at (1). Here we are going to use the "Climatologies (months)".

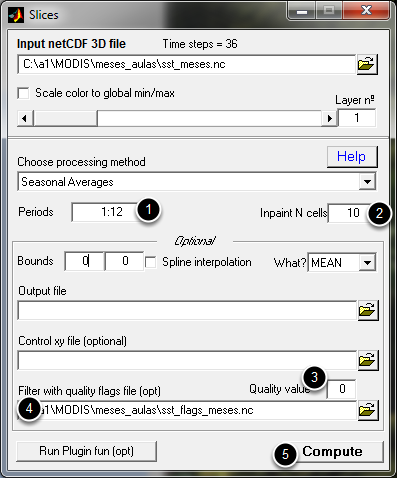
(1) Is the default seting and means compute averages over ensemples of 12, that is anual when layers are monthly data. (2) is a parameter that selects the maximum gaps, in nember of grid cells, that will be filled by iterpolation. (3) Selects the quality flag to apply to data (For MODIS '0' means retain only the best quality data). (4) Holds the name of the grid with the quality flags. We obtain one such grid by runing the "Make a stack of L3 MODIS files" Lesson with a "sds2" parameter to select Qualities instead of SSTs. At the end, hit (4) and provide a file name to save the result.