Display plate boundaries, earthquakes, volcanoes, hydrothermal sites ...
We will show how to display ...
Open a background image
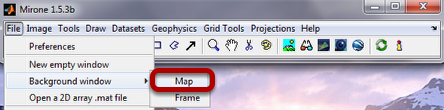
Click File -> Background window -> Map to bring up the mosaic tool
The mosaic window
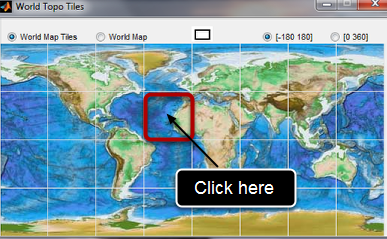
Click on a rectangle to bring up a nice resolution image of the region delimited by that rectangle.
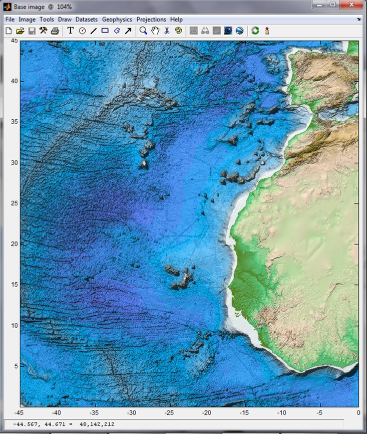
The background image for this example
Plot the plate boundaries
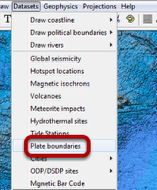
Plate boundaries + hydrothermal sites + volcanoes + meteoritic impact sites
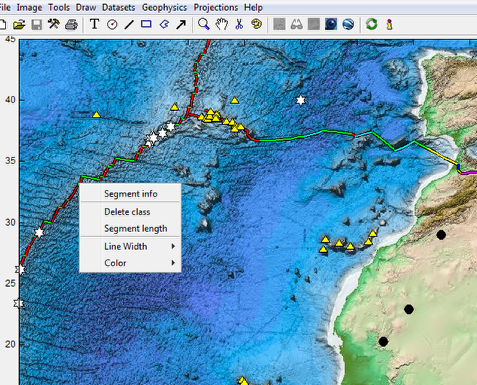
White stars represent hydrothermal sites, yellow triangles are volcanoes and black dots meteoritic impacts. Right-clicking on any of those elements brings up an menu where user has available information about that particular element. The figure shows one example of asking information about a MAR segment (spreading velocity is one of reported infos).
Plot a (referenced) world map image
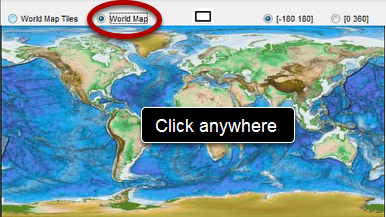
Select Word Map (notice that grid disappears) and click anywhere on the image
Plot global seismicity with magnitude >= 5
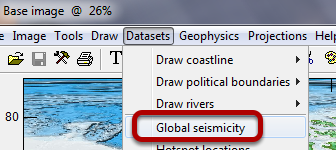
After the large image had popped-up do as above to display the plate boundaries and overlay the global seismicity (magnitude > 5).
The seismicity plot helper window
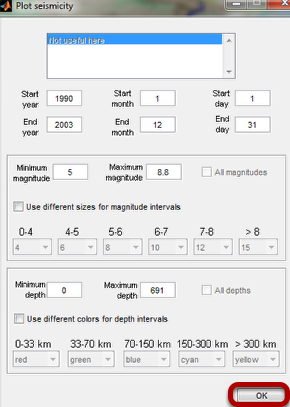
You can control many things in this window but for this example we will use all the defaults. So, just click OK
World seismicity + plate boundaries
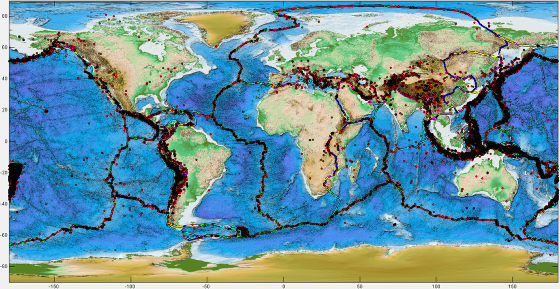
And there we have it: global seismicity overlaying the plate boundaries (yes, they are under the red dots).