bar3
bar3(cmd0::String="", arg1=nothing; kwargs...)keywords: GMT, Julia, 3D bar plots
Plots a 3D bar graph. The input can either be a file name of a file with at least three columns (x,y,z), but optionally more, a GMTdatset object with also three or more columns. However, the simplest usage is to provide a grid object (a GMTgrid) or a MxN matrix (with M,N > 3) and accept the defaults set for these data types. When not using grids or matrices the width keyword (see below) is mandatory, unless both xsize and ysize are given as two extra data columns. When using file names, however, it is necessary to tell the program if it is going to read a grid or a table. That is achieved by using grd=true or dataset=true, respectively.
This module is a subset of plot to make it simpler to draw 3D bar plots. So not all (fine) controlling parameters are listed here. For a finer control, user should consult the plot module.
Parameters
B or axes or frame
Set map boundary frame and axes attributes. Default is to draw and annotate left, bottom and vertical axes and just draw left and top axes. More at frame
J or proj or projection : – proj=<parameters>
Select map projection. More at proj
R or region or limits : – limits=(xmin, xmax, ymin, ymax, zmin, zmax) | limits=(BB=(xmin, xmax, ymin, ymax, zmin, zmax),) | ...more
Specify the region of interest. Default limits are computed from data extents. More at limits
G or markerfacecolor or MarkerFaceColor or markercolor or mc or fill
Select color or pattern for filling of symbols [Default is no fill]. Note that plot will search for fill and pen settings in all the segment headers (when passing a GMTdaset or file of a multi-segment dataset) and let any values thus found over-ride the command line settings (but those must be provided in the terse GMT syntax). See Setting color for extend color selection (including color map generation).
bar
column (3-D) extending from base to z. By default, base is 0 and the bar widths are 0.85 of the width in x-units. You can change this by using (in alternative):width=xx
where xx is the bar width in x-units (bar base remains = 0).base=xx
where xx is the base value (bar width remains = 0.85).bar=??
where ?? is a string with a full GMT syntax for this option (-Sb)bar=(width=xx,unit=xx,base=xx,height=xx)
Full featured option. Attention, the order of members matters. unit must always come after width, but otherwise they are all optional.width
The bar width in x-units. To specify it in plot units, use the unit member withcm,inchorpoint.unit
In case width is given in plot units. Valid units arecm,inchorpoint.base=xx
where xx is the base value.height
If the bar height is measured relative to base xx [Default is relative to origin]. Cannot be used together with base.
The facet colors will be modified to simulate shading. Use noshade=true to disable such 3-D illumination. Normally a single z value is considered. For multi-band columns, use nbands=n (and provide n z-values on input; these must be monotonically increasing up the column) or Nbands=n (and expect n of dz increments that must be summed to yield actual z values). The multi-band column symbol requires a fill=cmap (i.e. the use of a colormap) and will use the band number (0, 1, nbands-1) to assign the band color. The way to use these options is also as a separate keyword, or as an extra member of the bar tuple.
nbands=n or Nbands=n
or
bar=(width=xx,unit=xx,base=xx,height=xx,nbands=xx) (or Nbands=xx for last element)
p or view or perspective : – view=(azim, elev)
Default is viewpoint from an azimuth of 200 and elevation of 30 degrees.
Specify the viewpoint in terms of azimuth and elevation. The azimuth is the horizontal rotation about the z-axis as measured in degrees from the positive y-axis. That is, from North. This option is not yet fully expanded. Current alternatives are:view=??
A full GMT compact string with the full set of options.view=(azim,elev)
A two elements tuple with azimuth and elevationview=true
To propagate the viewpoint used in a previous module (makes sense only inbar3!)
More at perspective
figname or savefig or name : – figname=
name.png
Save the figure with thefigname=name.extwhereextchooses the figure image format.
Examples
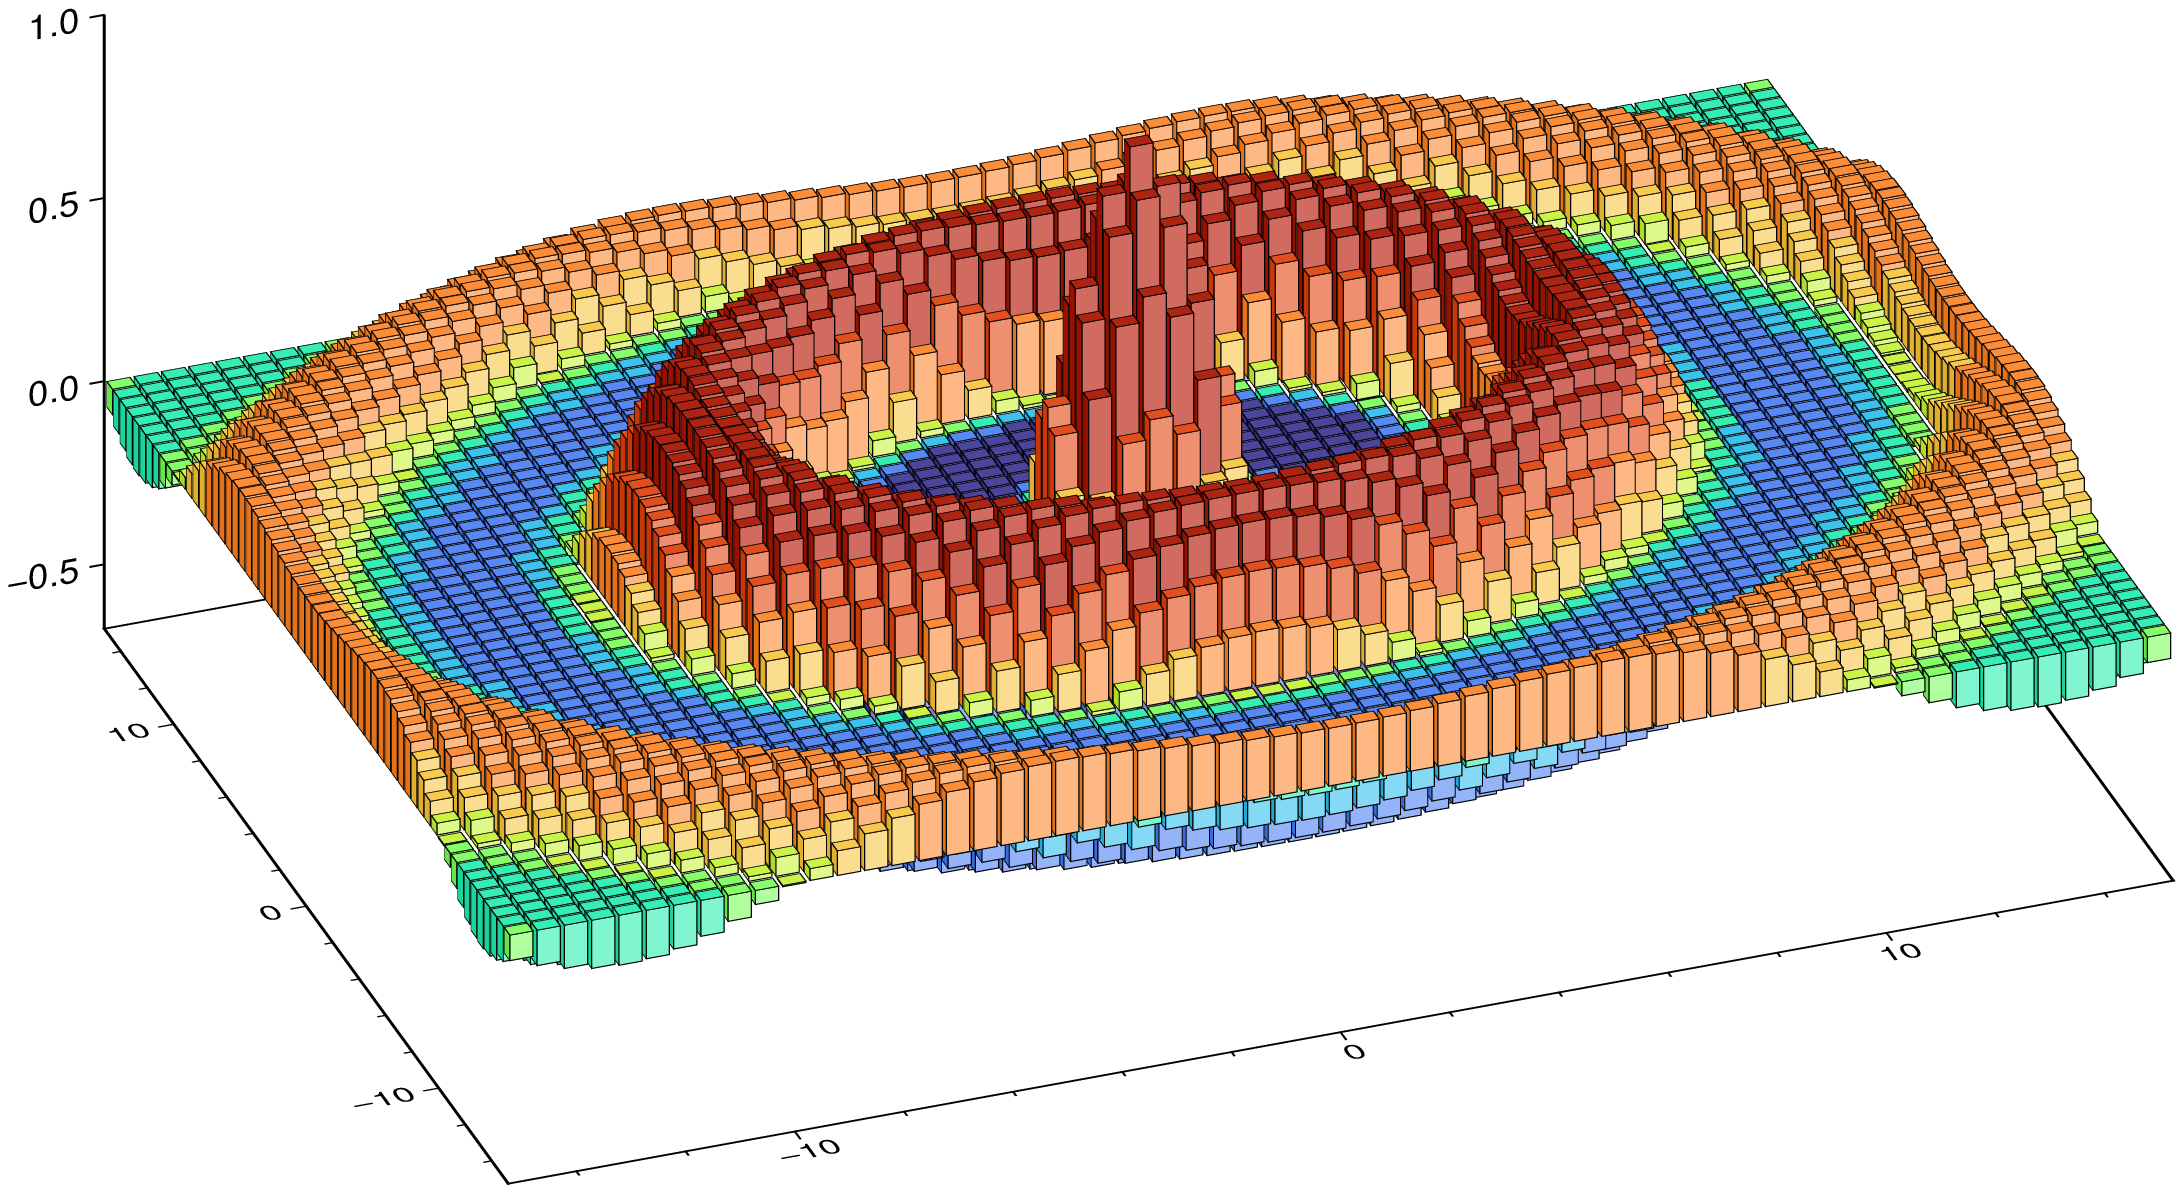
View a grid as a 3D bar plot
using GMT
G = gmt("grdmath -R-15/15/-15/15 -I0.5 X Y HYPOT DUP 2 MUL PI MUL 8 DIV COS EXCH NEG 10 DIV EXP MUL =");
cmap = grd2cpt(G);      # Compute a colormap with the grid's data range
bar3(G, lw=:thinnest, color=cmap, show=true)
See also
These docs were autogenerated using GMT: v1.23.0