bubblechart
bubblechart(cmd0::String="", arg1=nothing; size=?, kwargs...)Reads (x,y) pairs and plot bubbles at those locations on a map/figure. The input can either be a file name of a file with at least two columns (x,y), but optionally more, a GMTdatset object with also two or more columns.
bubblechart(x,y,size=?, kwargs...) plots the elements in y at the locations specified by x. The inputs x,y can be vectors or a vector and a matrix, both with the same number of rows. Bubble sizes are specified by size, which can be a scalar (all bubbles with same size), a two elements array (linear growing from min/max), or a tuple with a (restricted) function name and a limits two elements array. Ex: size=(exp10, [2,20]). If not provided, it defaults to 5 pt.
bubblechart(x,y,size=?,zcolor=?, kwargs...) specifies the colors of the bubbles. You can specify one color for all the bubbles, or you can vary the color. For example, you can plot all red bubbles by specifying fill=:red. Alternatively, zcolor can be an numeric array with same length as x and colors are be drawn from the active colormap.
bubblechart(D::GMTdatset,yvar,szvar=?, kwargs...) plots the specified variable from the GMTdatset against the row indices of the table and uses the variable szvar (or svar or sizevar) for the bubble sizes. To plot one set of y-values, specify one variable for yvar. This can take the form of column names or column numbers. To plot multiple sets of y-values, specify multiple variables for yvar. Example yvar=:Y or yvar=(2,3), or yvar=[:Y, :Z1, :Z2]. szvar selects a column with the bubble sizes, which defaukt to 5 pt if no column is selected.
bubblechart(D::GMTdatset,xvar,yvar,szvar=?,cvar=?, kwargs...) plots the specified variables from the dataset using the colors specified in the variable cvar (or colorvar) and colors are be drawn from the active colormap.
This module is a subset of plot to make it simpler to draw bubble plots. So not all (fine) controlling parameters are not listed here. For the finest control, user should consult the plot module.
Optional Arguments
B or axes or frame
Set map boundary frame and axes attributes. Default is to draw and annotate left, bottom and vertical axes and just draw left and top axes. More at frame
J or proj or projection : – proj=<parameters>
Select map projection. More at proj
R or region or limits : – limits=(xmin, xmax, ymin, ymax) | limits=(BB=(xmin, xmax, ymin, ymax),) | limits=(LLUR=(xmin, xmax, ymin, ymax),units="unit") | ...more
Specify the region of interest. More at limits. For perspective view view, optionally add zmin,zmax. This option may be used to indicate the range used for the 3-D axes. You may ask for a larger w/e/s/n region to have more room between the image and the axes.
G or markerfacecolor or MarkerFaceColor or markercolor or mc or fill
Select color or pattern for filling of symbols [Default is no fill]. Note that plot will search for fill and pen settings in all the segment headers (when passing a GMTdaset or file of a multi-segment dataset) and let any values thus found over-ride the command line settings (but those must be provided in the terse GMT syntax). See Setting color for extend color selection (including color map generation).
p or view or perspective : – view=(azim, elev)
Default is viewpoint from an azimuth of 200 and elevation of 30 degrees.
Specify the viewpoint in terms of azimuth and elevation. The azimuth is the horizontal rotation about the z-axis as measured in degrees from the positive y-axis. That is, from North. This option is not yet fully expanded. Current alternatives are:view=??
A full GMT compact string with the full set of options.view=(azim,elev)
A two elements tuple with azimuth and elevationview=true
To propagate the viewpoint used in a previous module (makes sense only inbar3!)
More at perspective
t or transparency or alpha: – alpha=50
Set PDF transparency level for an overlay, in (0-100] percent range. [Default is 0, i.e., opaque]. Works only for the PDF and PNG formats.
figname or savefig or name : – figname=
name.png
Save the figure with thefigname=name.extwhereextchooses the figure image format.
Examples
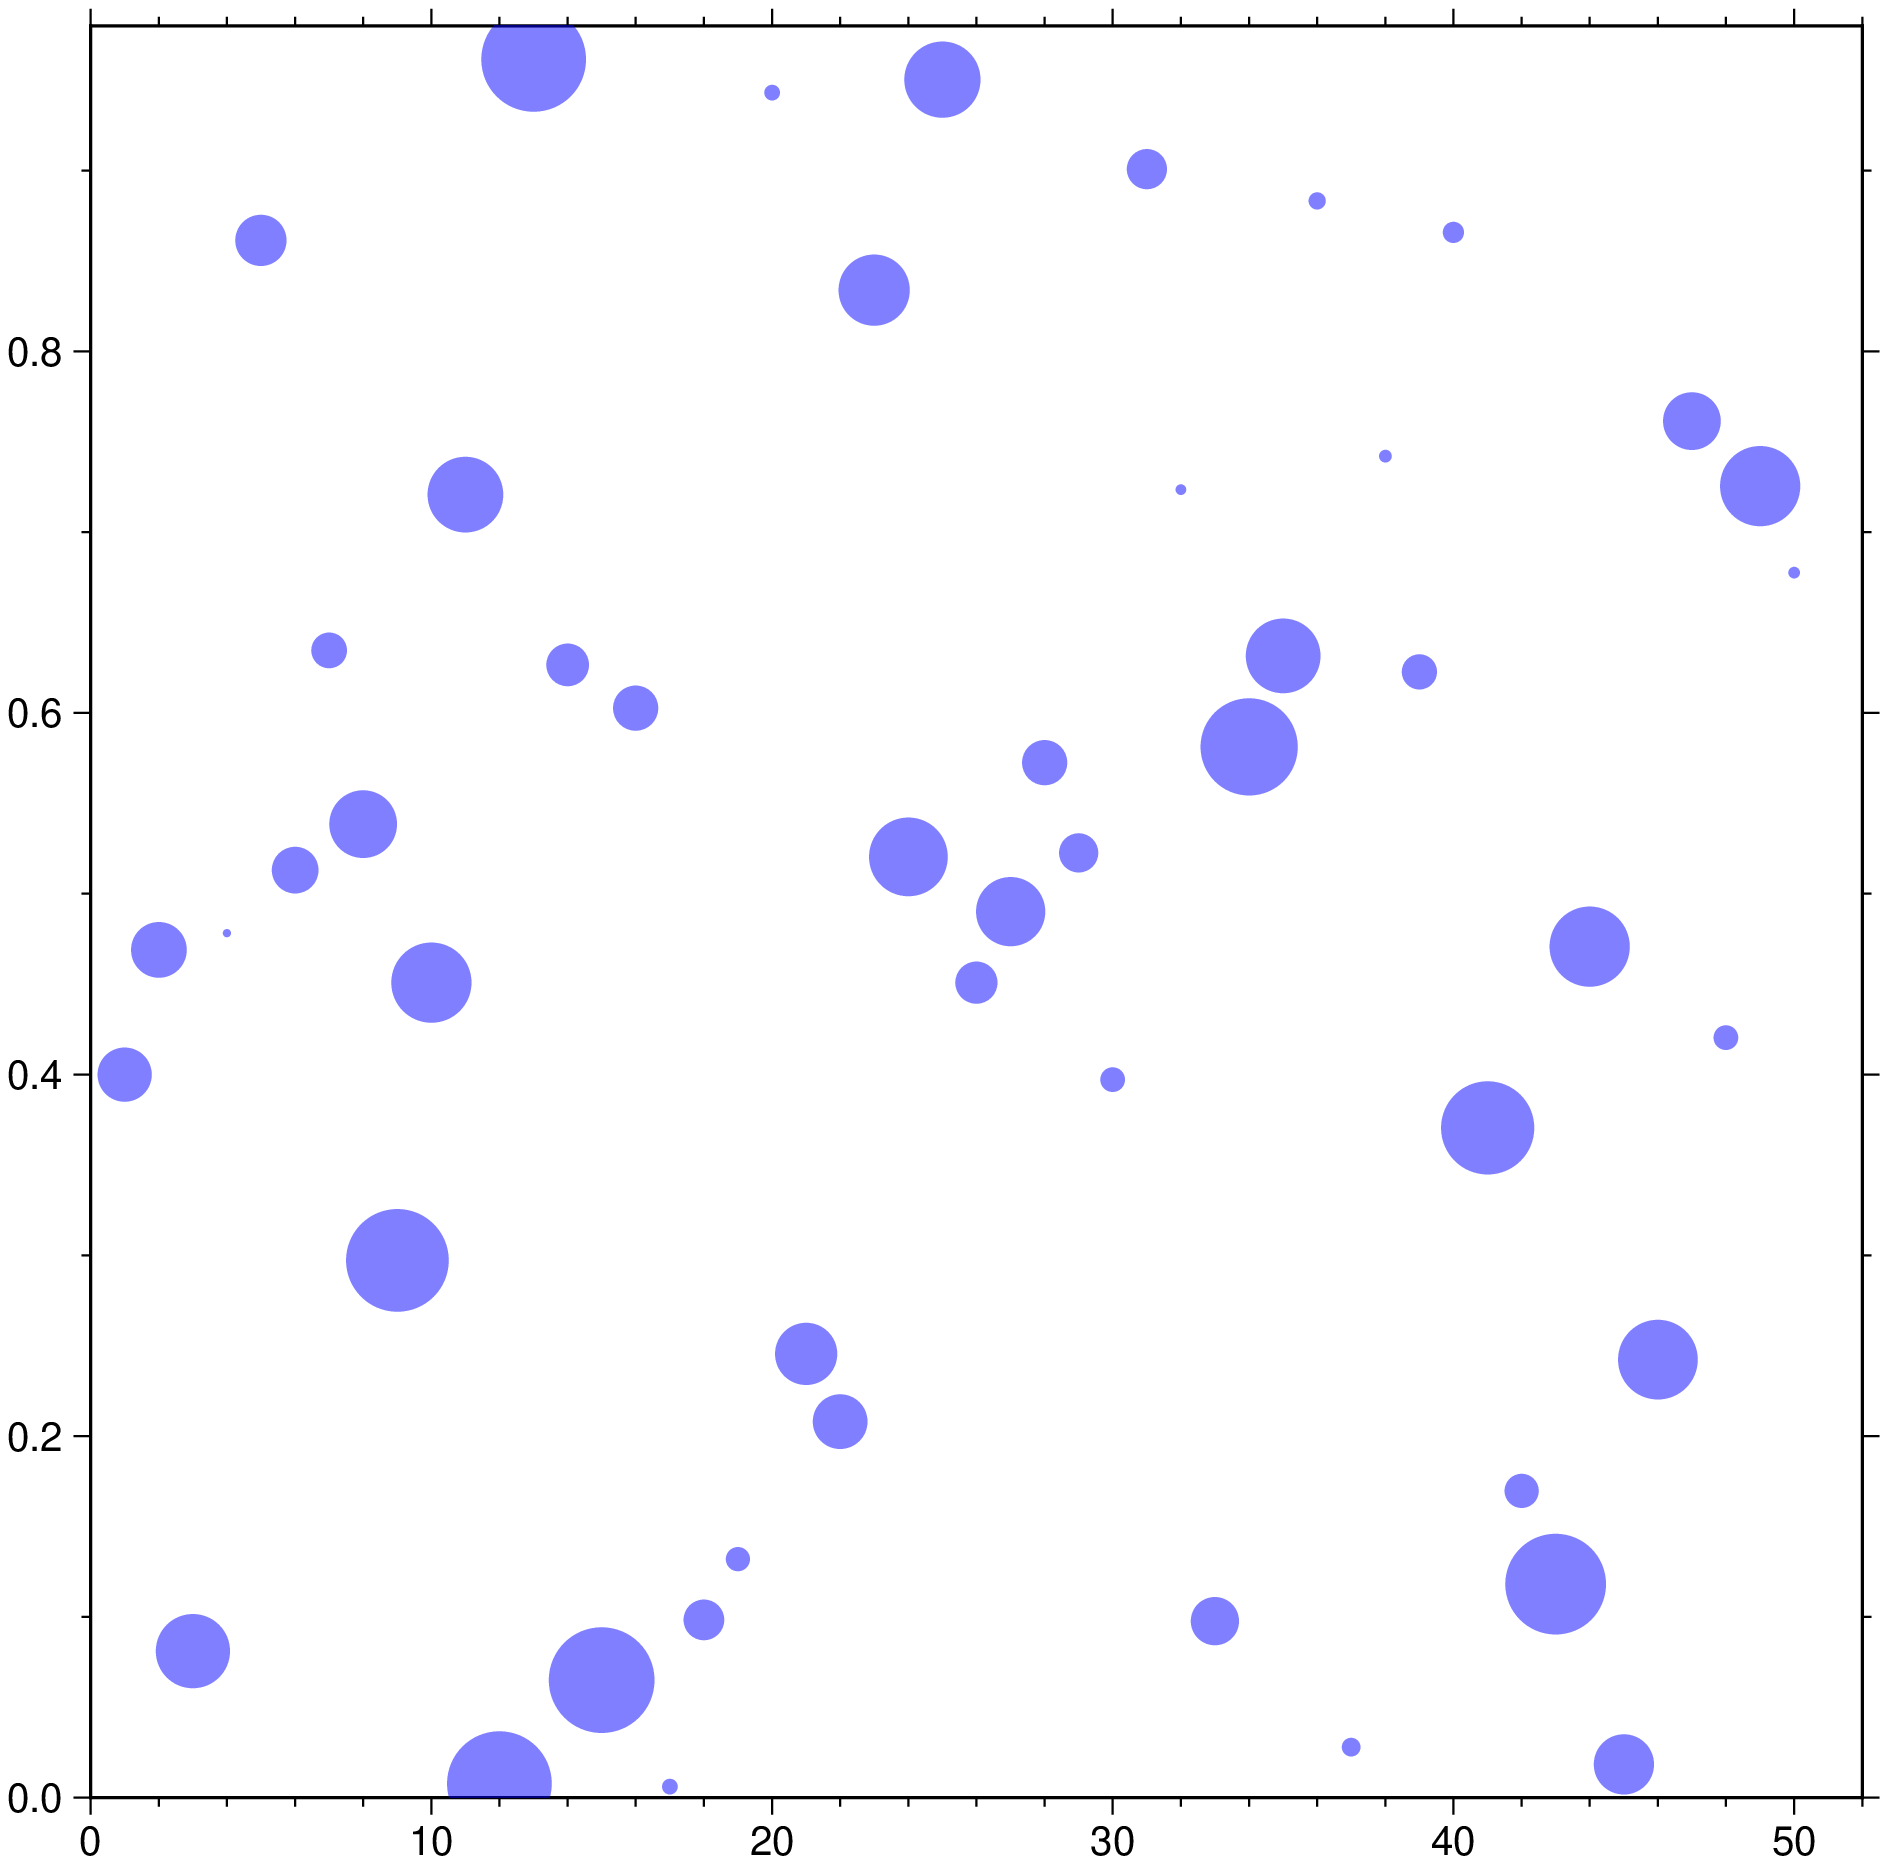
A simple bubble plot of 50 bubbles plotted with random sizes.
using GMT
bubblechart(1:50,rand(50), size=rand(50), fill=:blue, alpha=50, aspect="1:1", show=1)
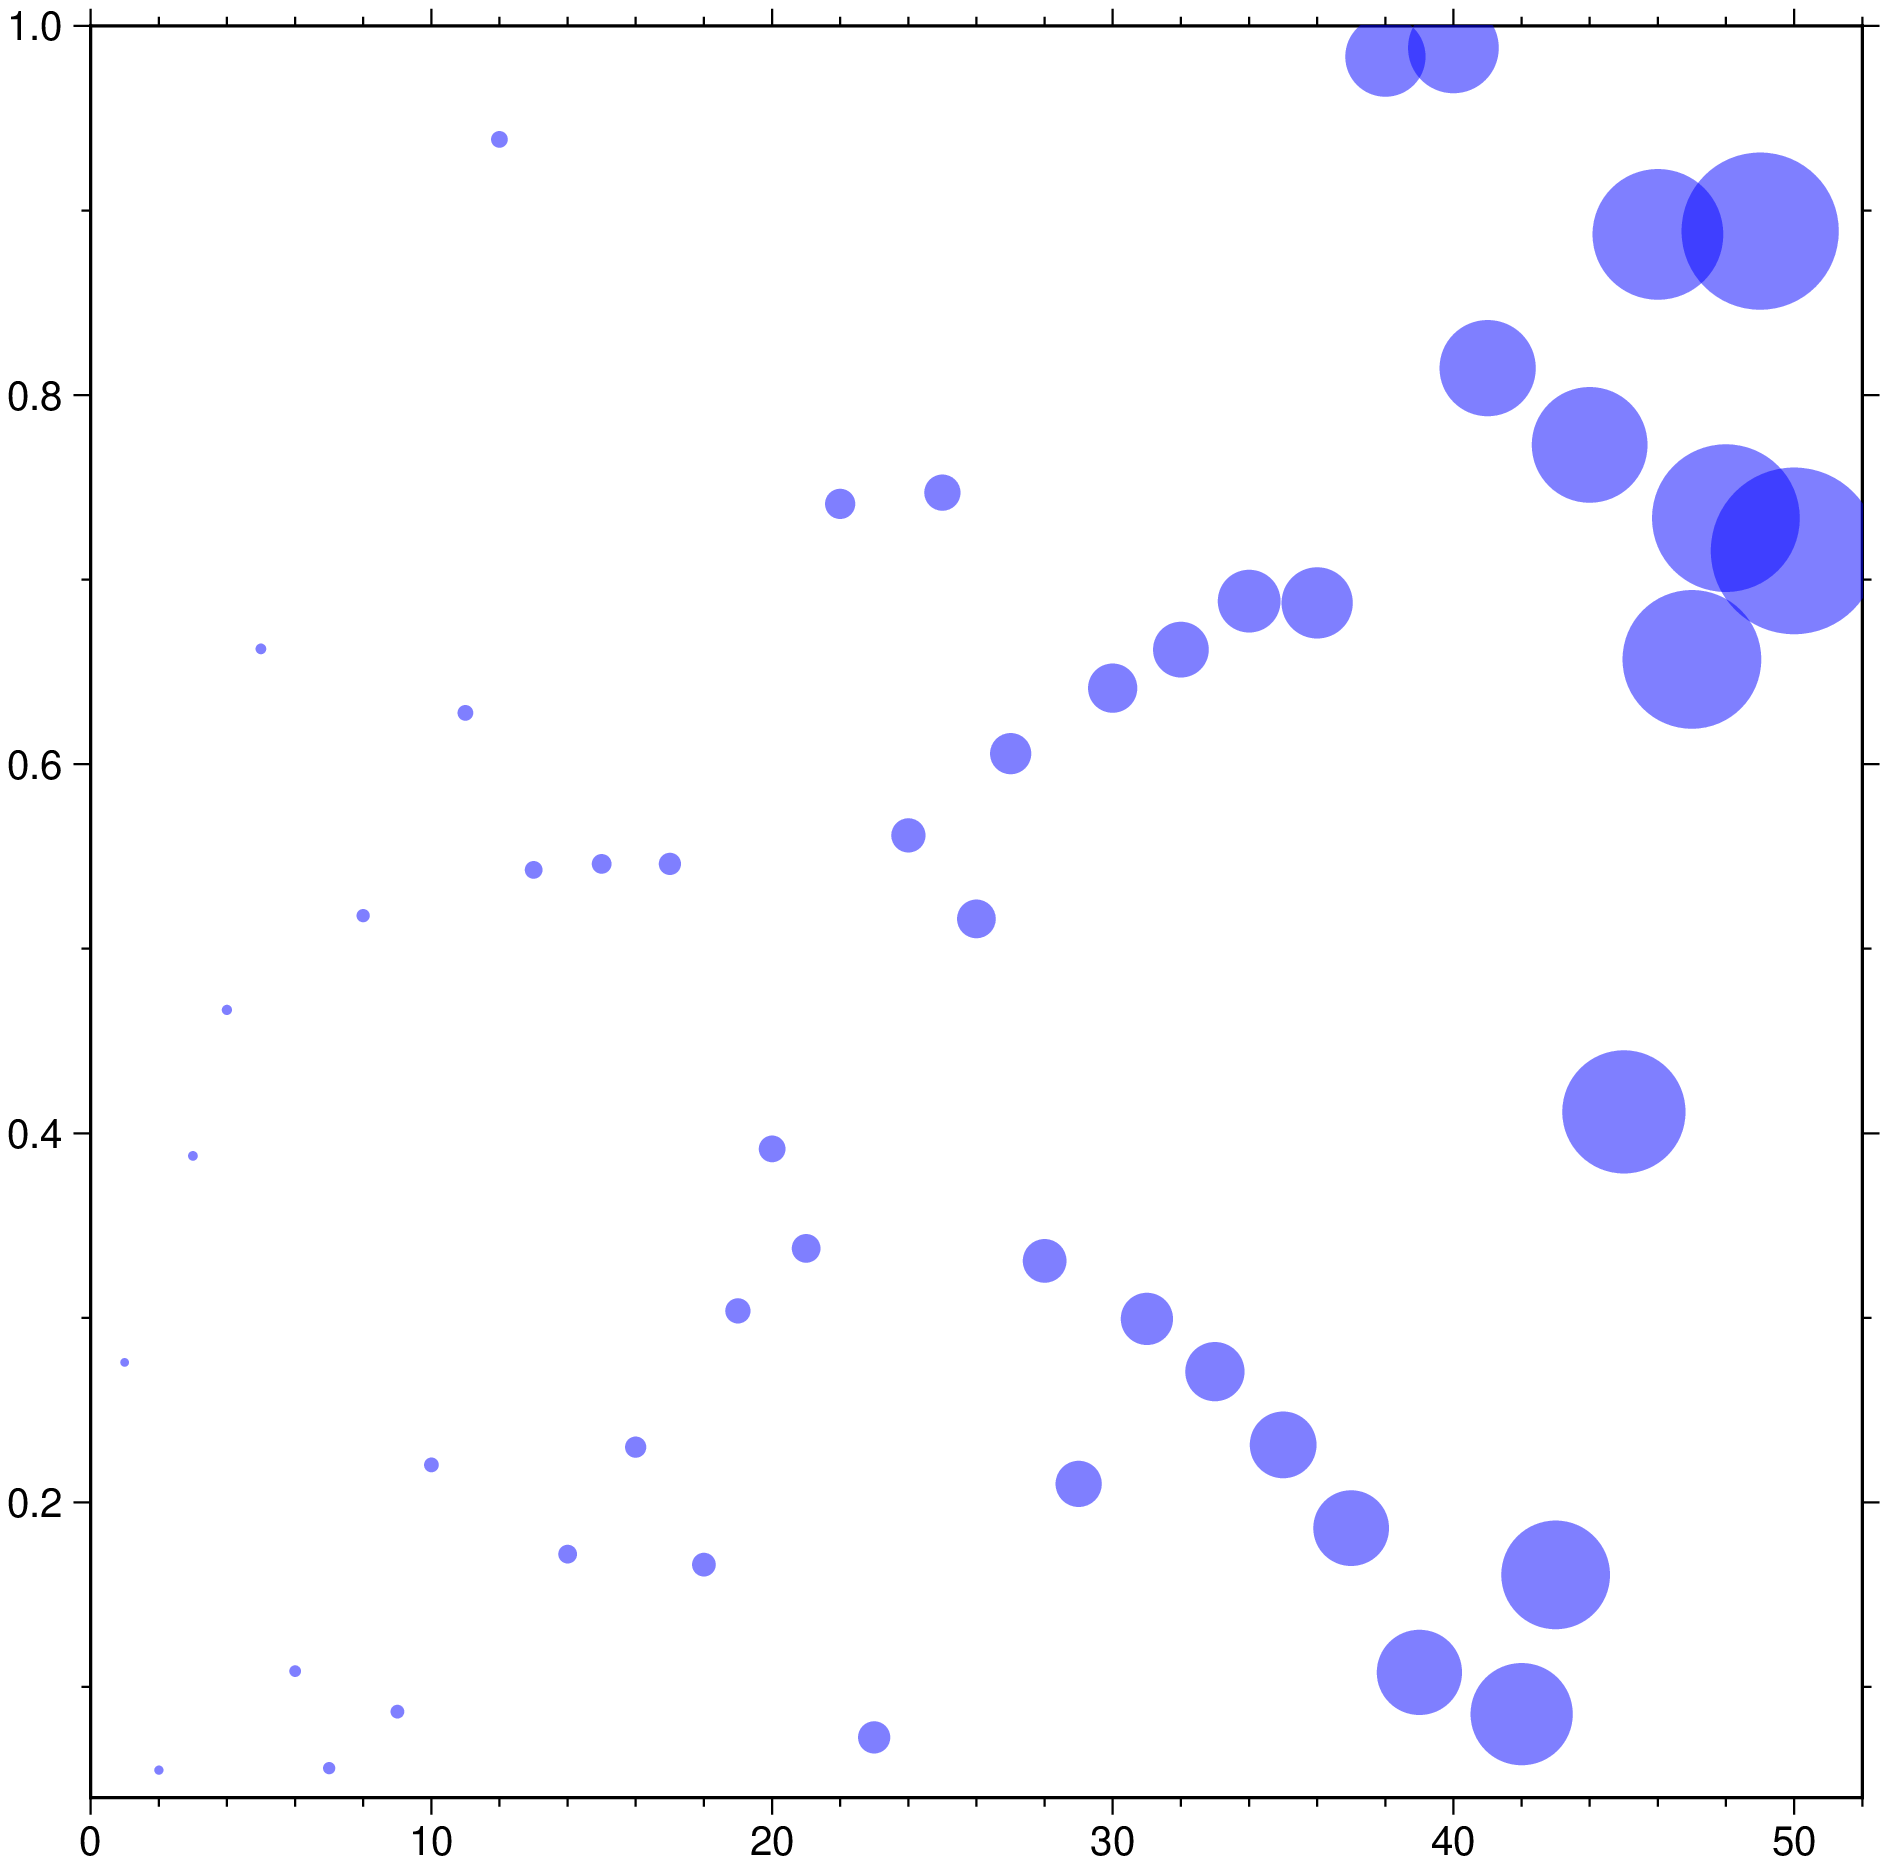
A plot where bubbles's size grows exponentialy between 2 and 40 points.
using GMT
bubblechart(1:50, rand(50), size=(exp10, [2,40]), fill=:blue, alpha=50, aspect="1:1", show=1)
These docs were autogenerated using GMT: v1.33.1