marginalhist
marginalhist(data; kwargs...)Takes a Mx2 array, and make a scatter plot of first vs second column. The default is to do a scatter3 plot if number of points <= 200 and bihex plot otherwise, but this is configurable. Input data can be a MxN matrix, a GMTdataset or a file name that upon reading with gmtread returns a GMTdataset.
The plot consists of histograms of each column along the diagonal and scatter or hexagonal bining plots for the inter-variable relations, depending on if the the number of samples is <= 2000. But this can be changed with options in kwargs.
marginalhist(data) Plots a x,y scatterplot with marginal histograms for x and y.
marginalhist(..., frac|fraction=xx) Set fractional size of the marginal plots with respect to the figure size. Default is 0.15 (15%).
marginalhist(..., gap=xx) Set the gap in centimeters between the fig and the marginal plots.
marginalhist(..., hexbin=true) Force hexbin plots even when number of points <= 2000. Default hexagon sizes are set via an heuristic rule but can be explicitly set via binstats options, Namely inc or nbins options. WARNING, this option requires that the scatter figure has dmensions with an aspect ratio of 1, which is not the case with the default figure size. To set fig dimensions with aspectratio = 1 use figsize="width/0" or set aspect=:equal.
marginalhist(..., nocbar=true) By default a colorbar is plot when doing hexbins. Use this option to not plot it.
marginalhist(..., scatter=true) Force scatter plots even when number of points > 2000. Symbol type (black little circles by default) parameters, fill color and size, are controllabe via normal plot options.
marginalhist(..., density=true) Side plots contain data kernel density instead of histograms. Fill color and outline are controlable via the histkw (or hist_kw or histkwargs or hist_kwargs) options.
marginalhist(..., histcolor|histfill=color) To paint the side histograms/density with a selected color (use histcolor=:none to no paint).
marginalhist(...,xvar,yvar) plots the variables xvar and yvar from the table D. You can specify one or multiple variables for yvar and one only for xvar.
marginalhist(..., histkw=args): Where args is a NamedTuple with parameters controlling the histogram plot (same options as those that would be passed to the histogram module, except region and figsize).
Several other options can be used through kwargs to control plot details. Namelly options to fine control the marginal plot colors and that are passed to subplot. Options to control the number of bins, and thresholds on countings, passed to binstats. Or options to change markers, marker size and or color, colormap, etc, passed to plot.
Common options
U or time_stamp : – time_stamp=true | time_stamp=(just="code", pos=(dx,dy), label="label", com=true)
Draw GMT time stamp logo on plot. More at timestamp
V or verbose : – verbose=true | verbose=level
Select verbosity level. More at verbose
X or xshift or x_offset : xshift=true | xshift=x-shift | xshift=(shift=x-shift, mov="a|c|f|r")
Shift plot origin. More at xshift
Y or yshift or y_offset : yshift=true | yshift=y-shift | yshift=(shift=y-shift, mov="a|c|f|r")
Shift plot origin. More at yshift
figname or savefig or name : – figname=
name.png
Save the figure with thefigname=name.extwhereextchooses the figure image format.
Examples
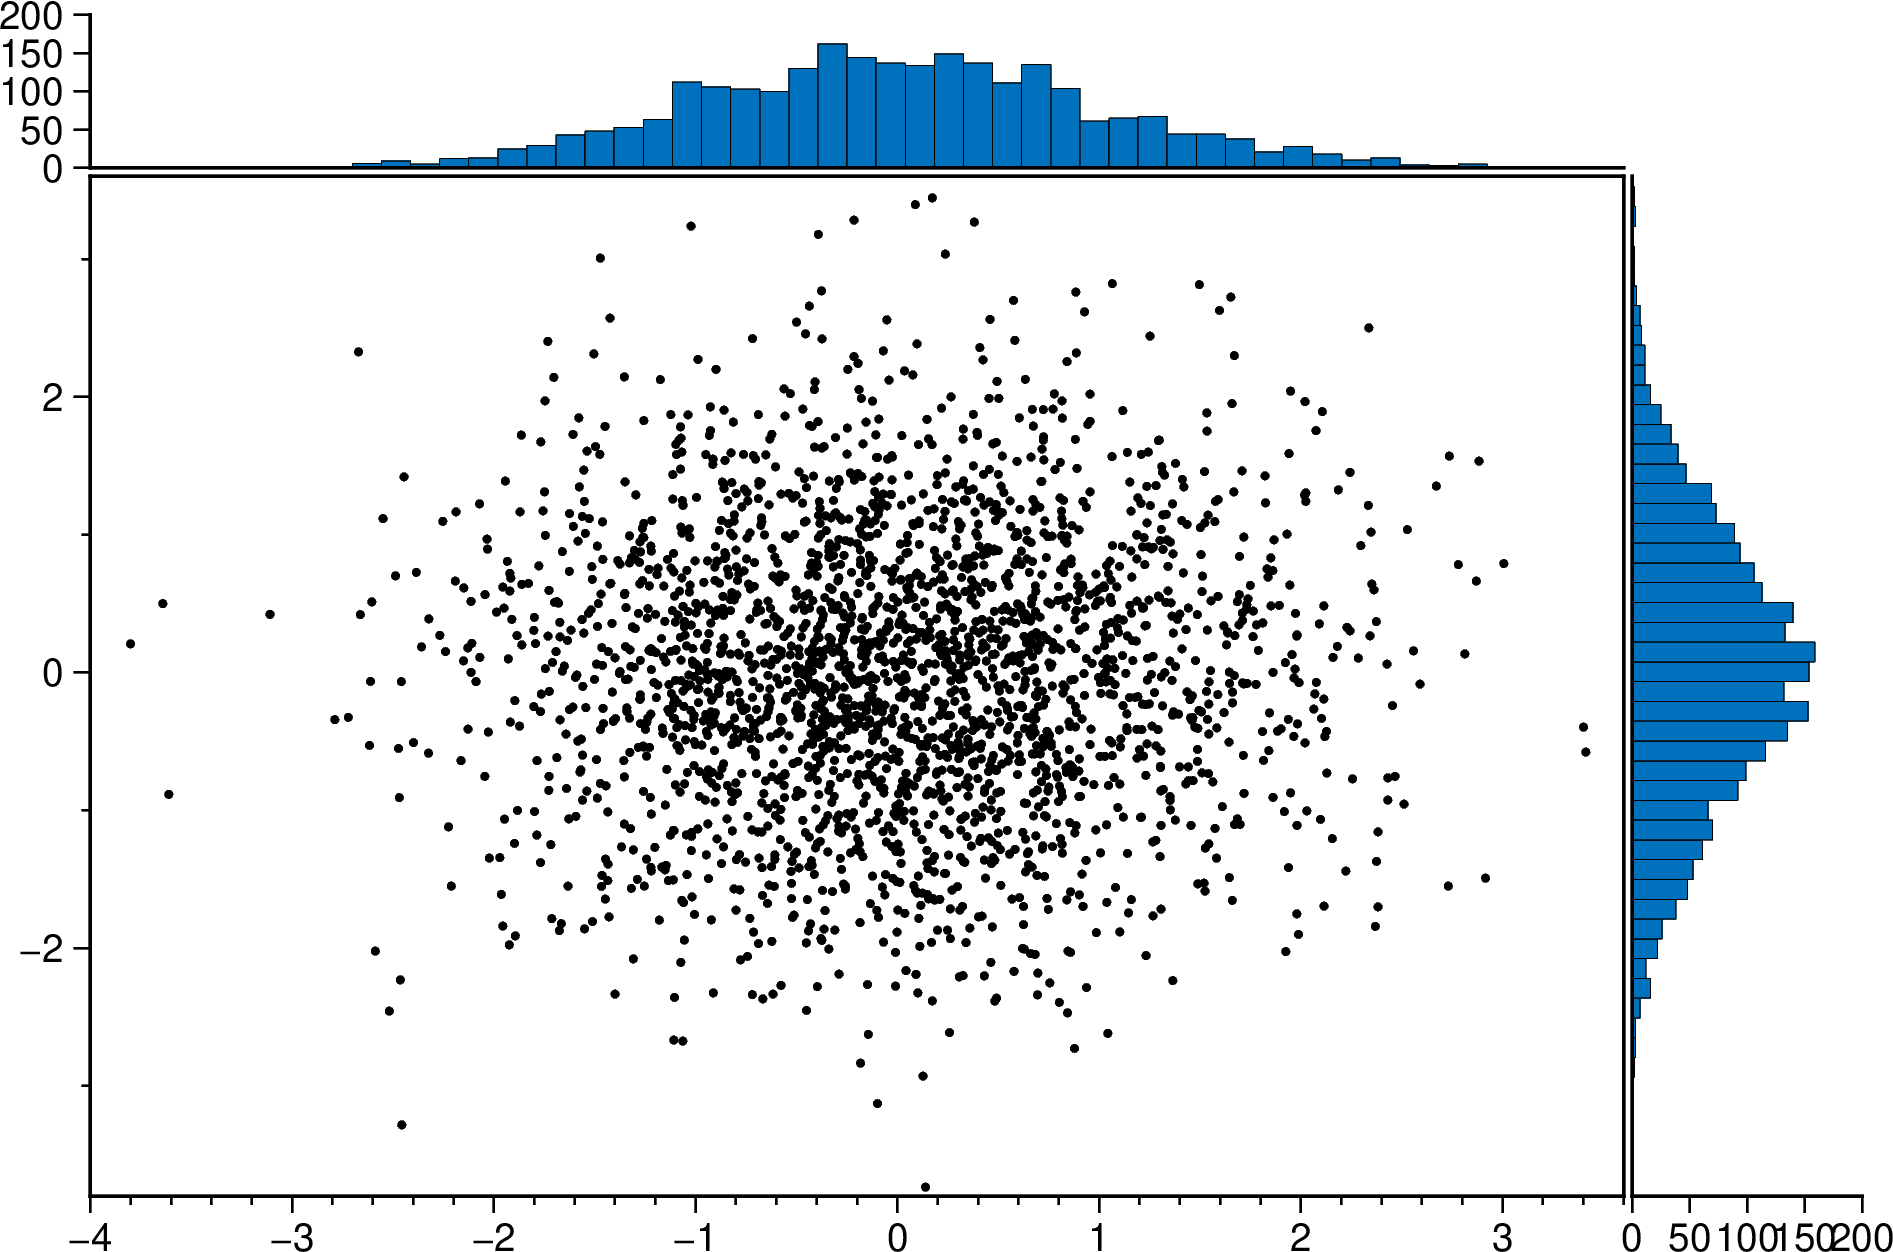
Create a simple scatter plot with annotated (count numbers in histograms)
using GMT
marginalhist(randn(2500,2), scatter=true, histkw=(annot=true,), show=true)
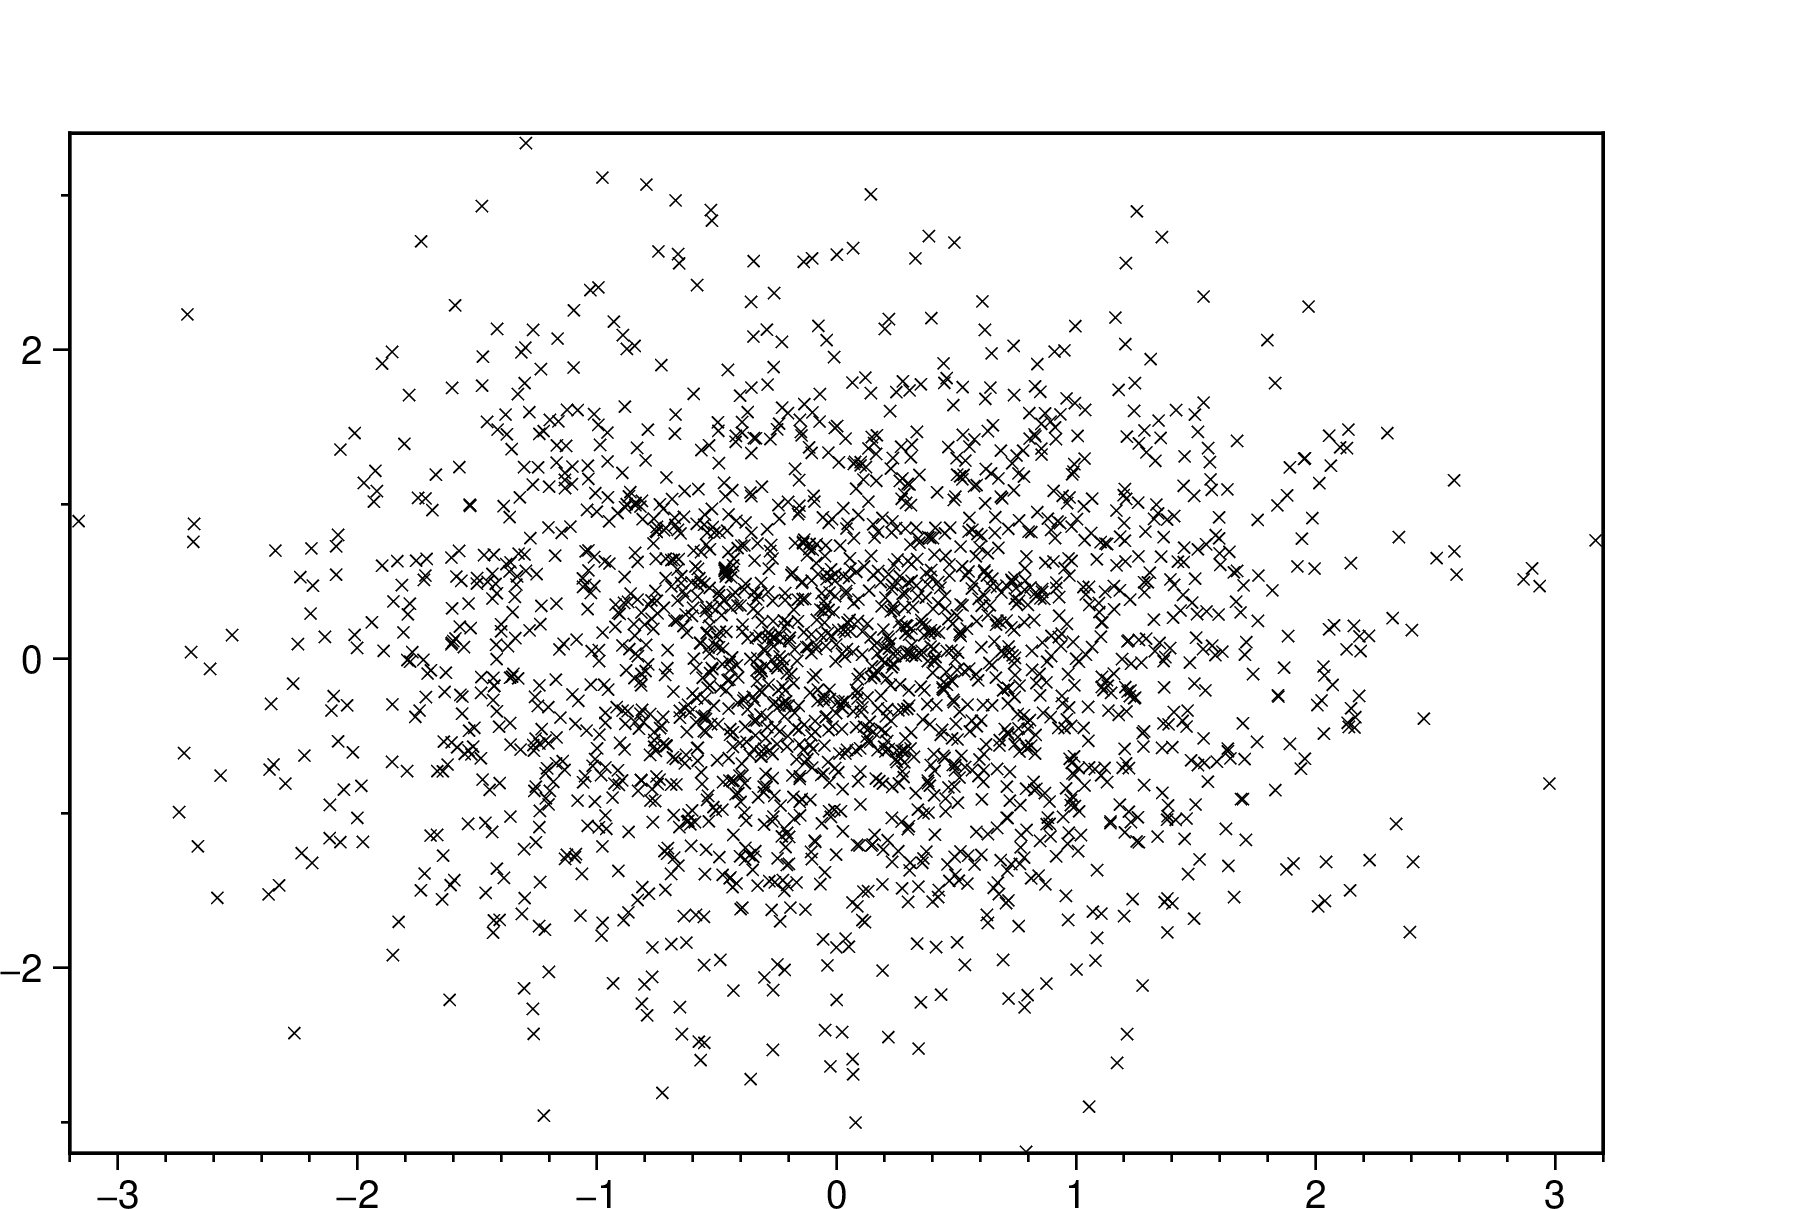
Change mrker type and histogram's default color.
using GMT
marginalhist(randn(2000,2), histkw=(frame="none", fill=:tomato, W="0@100"),
             marker=:cross, ms="4p", show=true)
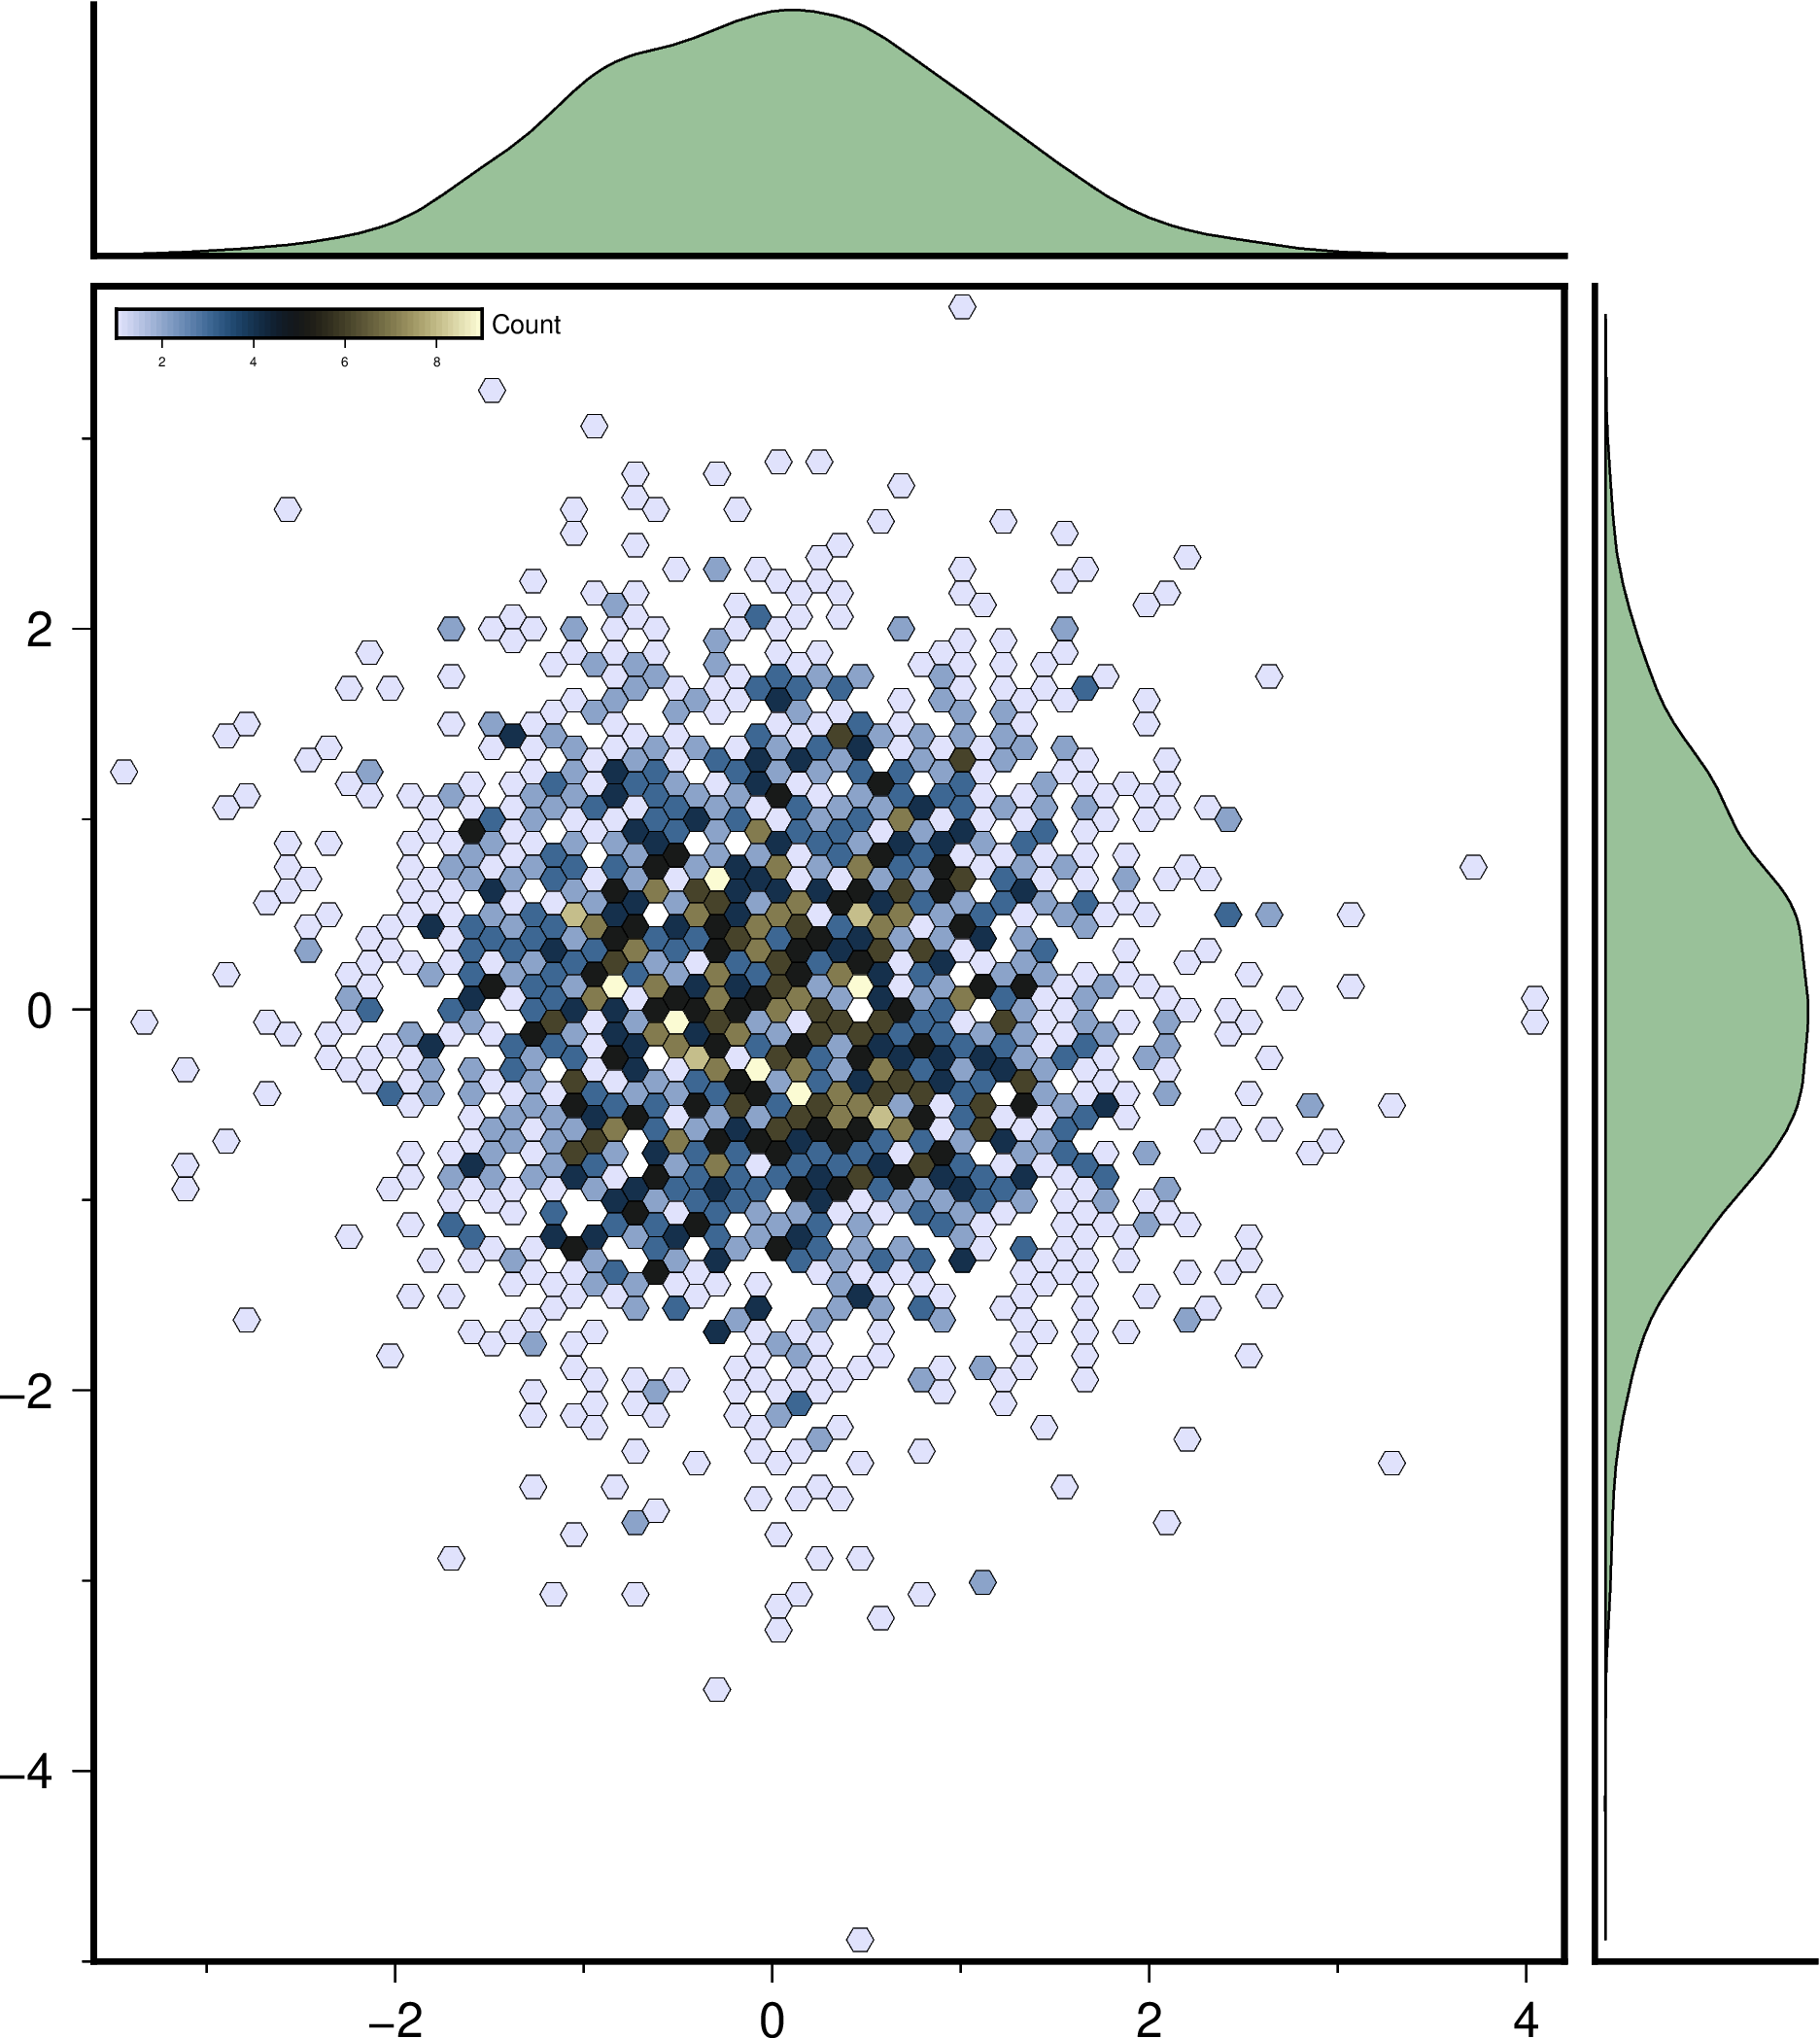
An hexbin scater plot with marginal density plots. Note that we must set aspect=:equal to have that hexbin plot.
using GMT
marginalhist(randn(2500,2), cmap=:lisbon, density=true, histkw=(fill="darkgreen@60",),
             aspect=:equal, show=true)
See Also
cornerplot, plot, binstats, histogram
These docs were autogenerated using GMT: v1.33.1