mask
mask(cmd0::String="", arg1=[]; kwargs...)

or

mask(GI:GItype, shapes::GMTdataset, touches=false, inverse::Bool=false, maskvalues=??)
Clip or mask map areas with no data table coverage
Description
Reads (x, y, z) tables (or a file) and uses this information to find out which grid cells are reliable. Only grid cells which have one or more data points are considered reliable. As an option, you may specify a radius of influence. Then, all grid cells that are within radius of a data point are considered reliable. Furthermore, an option is provided to reverse the sense of the test. Having found the reliable/not reliable points, the module will either paint tiles to mask these nodes (with the tiles switch), or use contouring to create polygons that will clip out regions of no interest. When clipping is initiated, it will stay in effect until turned off by a second call to the module using the endclip option.
A second method expects a GMTgrid or an GMTimage as first argument and a GMTdataset in second and will clip the grid/image to the selected region(s) defined in polygons of the second argument. Grids are clipped to the global BoundingBox of the polygons and images are copped to that limit and set to transparent in the regions outside of the polygons. This method uses GDAL to compute the clipping mask. Used together with the DCW option of coast this is very handy to clip rasters to country or earthregions boundaries. Note that this method is in a way similar to one of the grdlandmask methods. The difference is that here use a external polygon description that may be read from any OGR vector file whilst grdlandmask uses the GSHHG dataset.
Required Arguments (1st method)
table
One or more data tables holding a number of data columns.
I or inc or increment or spacing : – inc=x_inc | inc=(xinc, yinc) | inc="xinc[+e|n][/yinc[+e|n]]"
Specify the grid increments or the block sizes. More at spacing
J or proj or projection : – proj=<parameters>
Select map projection. More at proj
R or region or limits : – limits=(xmin, xmax, ymin, ymax) | limits=(BB=(xmin, xmax, ymin, ymax),) | limits=(LLUR=(xmin, xmax, ymin, ymax),units="unit") | ...more
Specify the region of interest. More at limits. For perspective view view, optionally add zmin,zmax. This option may be used to indicate the range used for the 3-D axes. You may ask for a larger w/e/s/n region to have more room between the image and the axes.
R or region or limits : – limits=(xmin, xmax, ymin, ymax, zmin, zmax) | limits=(BB=(xmin, xmax, ymin, ymax, zmin, zmax),) | ...more
Specify the region of interest. Default limits are computed from data extents. More at limits
Required Arguments (2nd method)
GI: A grid (GMTgrid) or image (GMTimage) to be clipped.
shapes: A GMTdataset or a vector of them containing the polygons outside which the elements ofGIwill be clipped
Optional Arguments
B or axes or frame
Set map boundary frame and axes attributes. Default is to draw and annotate left, bottom and vertical axes and just draw left and top axes. More at frame
C or endclip or endclippath : – endclip=true
Mark end of existing clip path. No input file is needed. Also supply xshift and yshift settings if you have moved since the clip started.
D or dump : – dump=fname
Dump the (x,y) coordinates of each clipping polygon to one or more output files (or in-memory array). No plotting will take place. If template contains the C-format specifier %d (including modifications like %05d) then polygons will be written to different files; otherwise all polygons are written to the specified file (template). The files are ASCII unless binary_out is used. See cut_number to exclude small polygons from consideration.
F or oriented : – oriented=:left | oriented=true | oriented=:right
Force clip contours (polygons) to be oriented so that data points are to the left ([Default]) or right (oriented=:right) as we move along the perimeter [Default is arbitrary orientation]. Requires dump.
G or fill : – fill=color
Paint the clip polygons (or tiles) with a selected fill [Default is no fill].
Jz or JZ or zscale or zsize : zscale=scale | zsize=size
Set z-axis scaling or or z-axis size.zsize=sizesets the size to the fixed value size (for example zsize=10 or zsize=4i).zscale=scalesets the vertical scale to UNIT/z-unit.
L or nodegrid : – nodegrid="gridname" | nodegrid="gridname+i" | nodegrid="gridname+o"
Save the internal grid with ones (data constraint) and zeros (no data) to the named *gridname. Append +o to convert the outside (no data) nodes to NaNs before writing the grid, while appending +i will instead convert the inside (data) flags to NaNs. Omitting the gridname, as in nodegrid=true or nodegrid="+i" returns a grid as a GMTgrid object.
N or inverse : – inverse=true
Invert the sense of the test, i.e., clip regions where there is data coverage.
Q or cut or cut_number : – cut=n Do not dump polygons with less than cut number of points [Dumps all polygons]. Only applicable if dump has been specified.
S or search_radius : – search_radius=rad
Sets radius of influence. Grid nodes within radius of a data point are considered reliable. [Default is 0, which means that only grid cells with data in them are reliable]. Append the distance unit (see Units).
T or tiles : – tiles=true
Plot tiles instead of clip polygons. Use fill to set tile color or pattern. Cannot be used with dump.
touches: For the grid/image method, include all cells/pixels that are touched by the polygons. The default is to include only the cells whose centers that are inside the polygons.
U or time_stamp : – time_stamp=true | time_stamp=(just="code", pos=(dx,dy), label="label", com=true)
Draw GMT time stamp logo on plot. More at timestamp
V or verbose : – verbose=true | verbose=level
Select verbosity level. More at verbose
X or xshift or x_offset : xshift=true | xshift=x-shift | xshift=(shift=x-shift, mov="a|c|f|r")
Shift plot origin. More at xshift
Y or yshift or y_offset : yshift=true | yshift=y-shift | yshift=(shift=y-shift, mov="a|c|f|r")
Shift plot origin. More at yshift
bi or binary_in : – binary_in=??
Select native binary format for primary table input. More at
di or nodata_in : – nodata_in=??
Substitute specific values with NaN. More at
e or pattern : – pattern=??
Only accept ASCII data records that contain the specified pattern. More at
h or header : – header=??
Specify that input and/or output file(s) have n header records. More at
i or incol or incols : – incol=col_num | incol="opts"
Select input columns and transformations (0 is first column, t is trailing text, append word to read one word only). More at incol
p or view or perspective : – view=(azim, elev)
Default is viewpoint from an azimuth of 200 and elevation of 30 degrees.
Specify the viewpoint in terms of azimuth and elevation. The azimuth is the horizontal rotation about the z-axis as measured in degrees from the positive y-axis. That is, from North. This option is not yet fully expanded. Current alternatives are:view=??
A full GMT compact string with the full set of options.view=(azim,elev)
A two elements tuple with azimuth and elevationview=true
To propagate the viewpoint used in a previous module (makes sense only inbar3!)
More at perspective
q or inrows : – inrows=??
Select specific data rows to be read and/or written. More at
r or reg or registration : – reg=:p | reg=:g
Select gridline or pixel node registration. Used only when output is a grid. More at
t or transparency or alpha: – alpha=50
Set PDF transparency level for an overlay, in (0-100] percent range. [Default is 0, i.e., opaque]. Works only for the PDF and PNG formats.
w or wrap or cyclic : – wrap=??
Convert input records to a cyclical coordinate. More at
yx : – yx=true
Swap 1st and 2nd column on input and/or output. More at
For map distance unit, append unit d for arc degree, m for arc minute, and s for arc second, or e for meter [Default unless stated otherwise], f for foot, k for km, M for statute mile, n for nautical mile, and u for US survey foot. By default we compute such distances using a spherical approximation with great circles (-jg) using the authalic radius (see PROJ_MEAN_RADIUS). You can use -jf to perform “Flat Earth” calculations (quicker but less accurate) or -je to perform exact geodesic calculations (slower but more accurate; see PROJ_GEODESIC for method used).
figname or savefig or name : – figname=
name.png
Save the figure with thefigname=name.extwhereextchooses the figure image format.
Examples
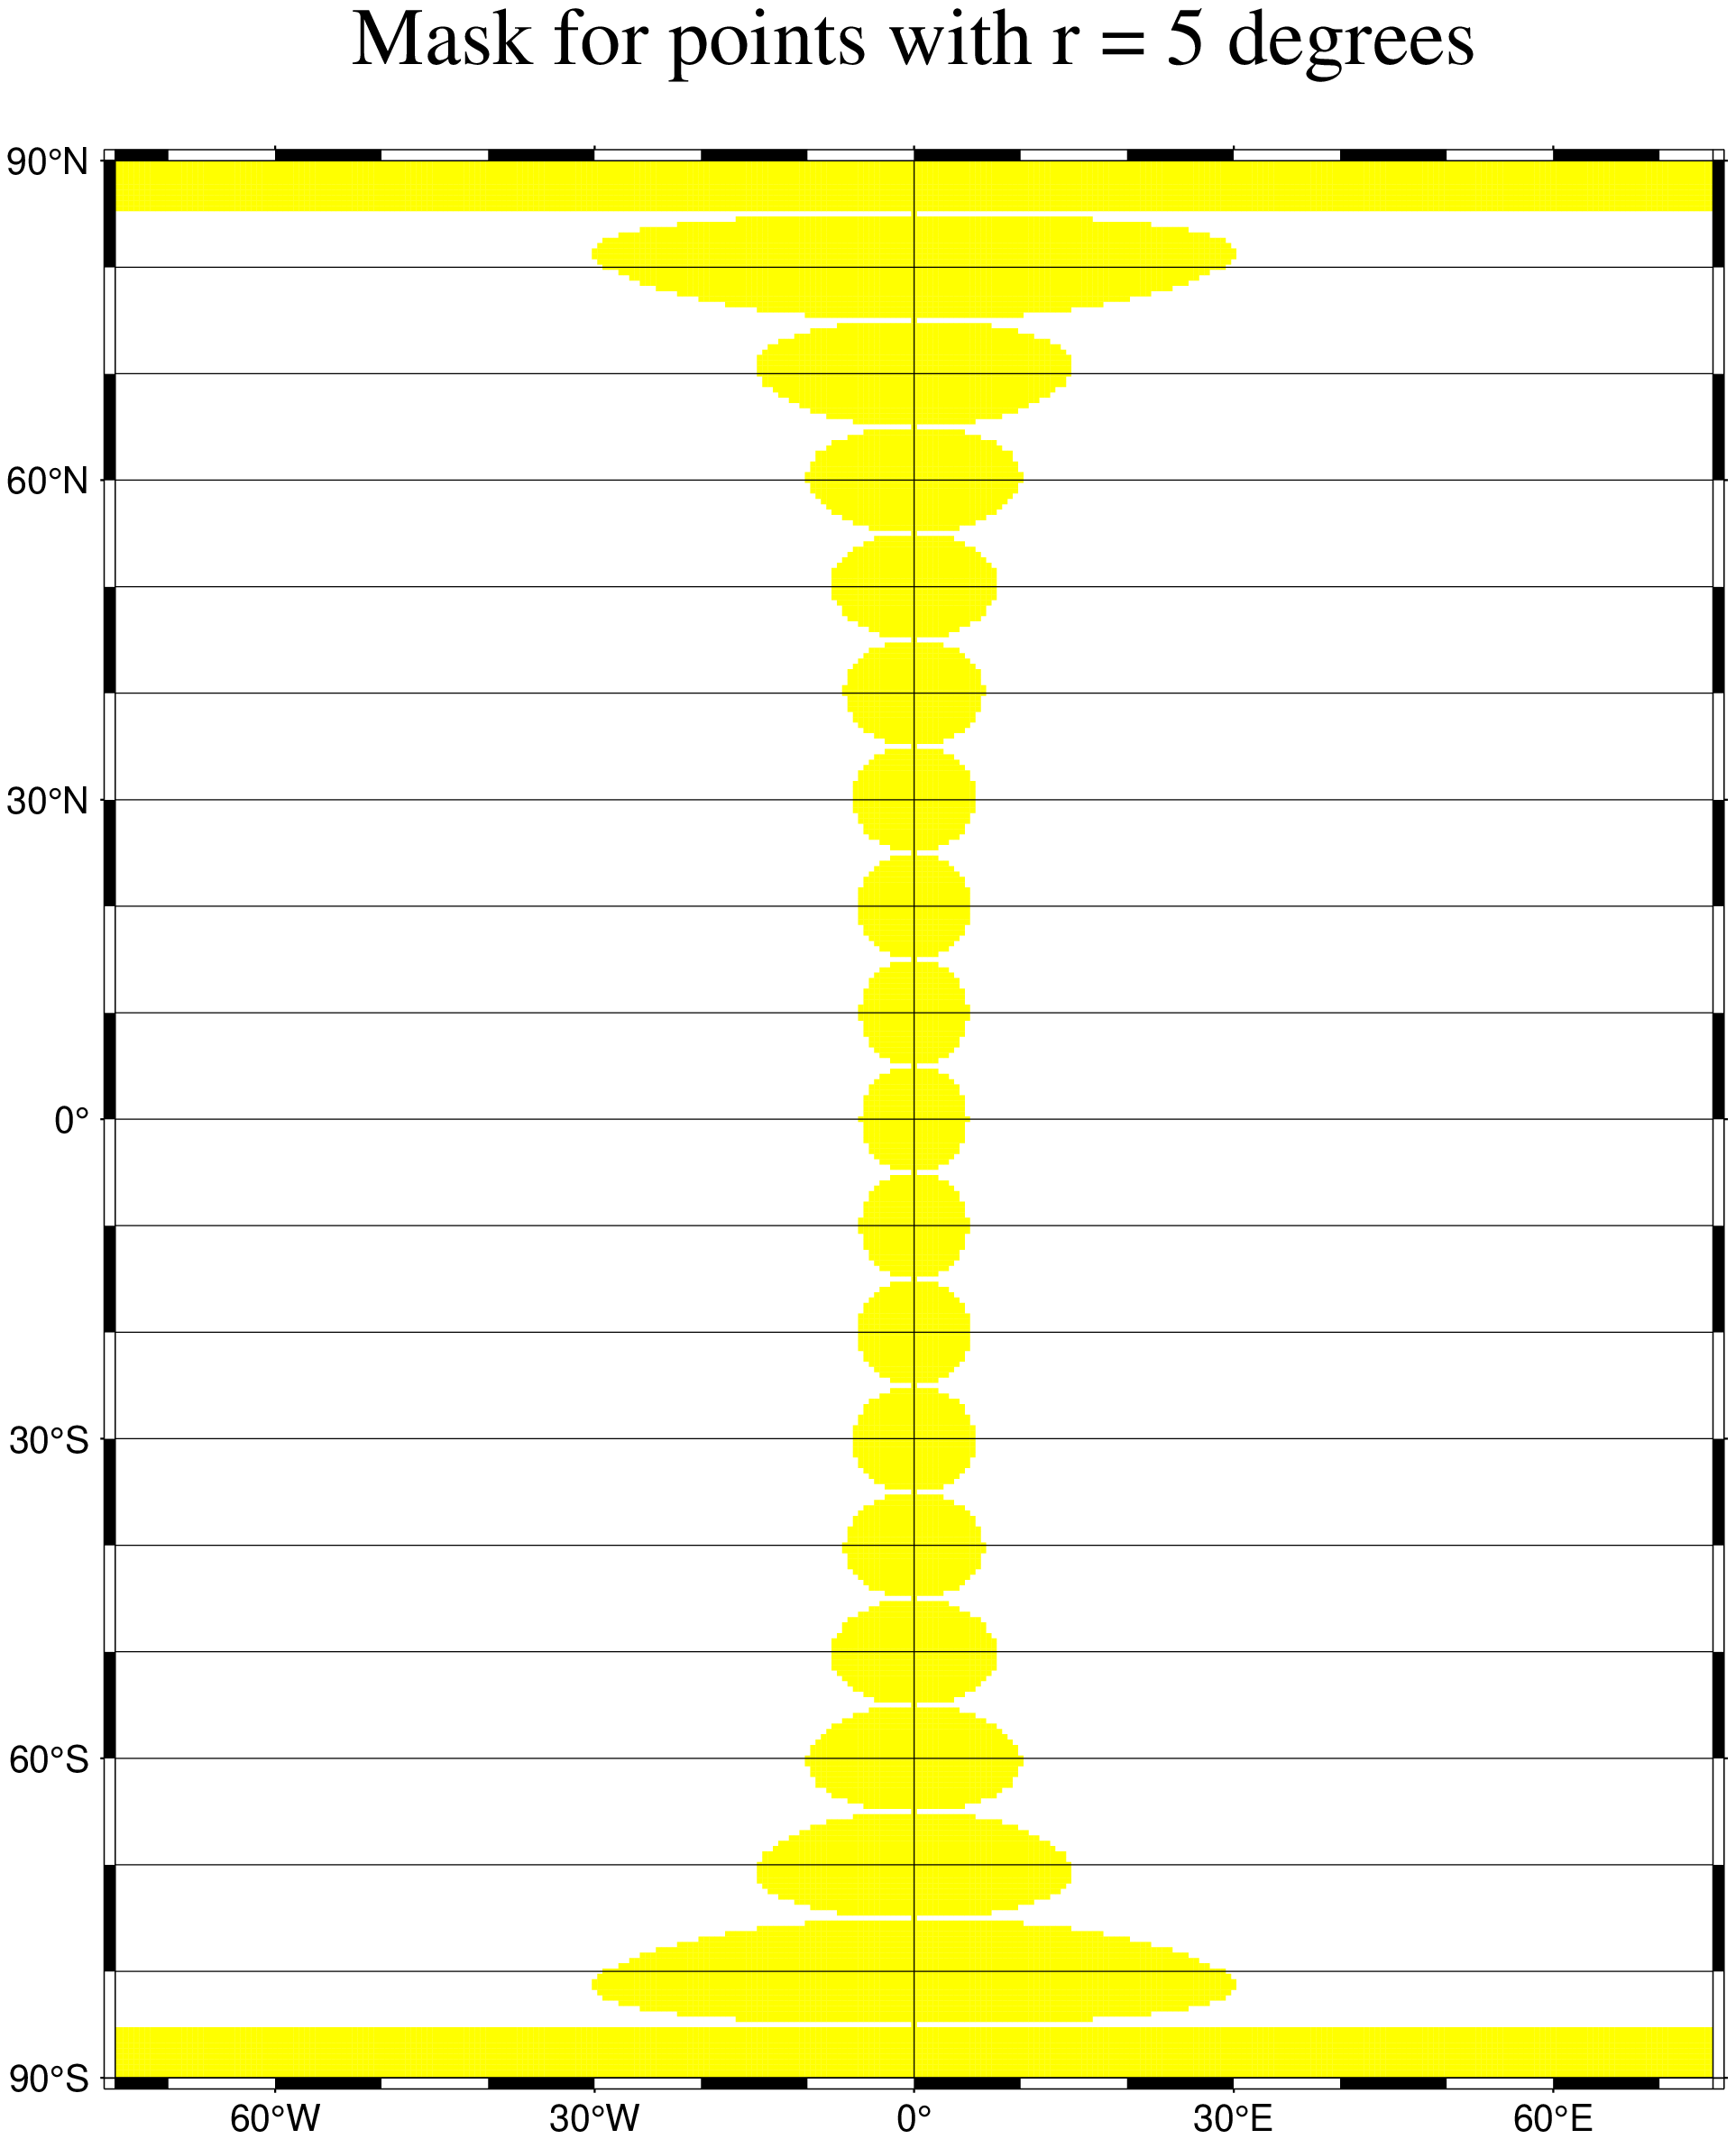
To make a mask that has a 5 degree radius around points spaced every 10 degree along the prime meridian, and just paint those areas yellow we try::
using GMT
t = [repeat([0],19) -90:10:90]      # Some fake data
mask(t, fill=:yellow, inc="30m", region=(-75,75,-90,90), proj=:eqc, search_radius="5d", tiles=true,
     title="Mask for points with r = 5 degrees", xaxis=(annot=:auto, ticks=:auto, grid=180),
     yaxis=(annot=:auto, ticks=:auto, grid=10), show=true)
To make an overlay that will mask out the regions of a contour map where there is no control data using clip polygons, use:
gmt mask africa_grav.xyg -R20/40/20/40 -I5m -JM10i -pdf maskWe do it again, but this time we wish to save the clipping polygons to file all_pols.txt:
gmt mask africa_grav.xyg -R20/40/20/40 -I5m -Dall_pols.txtA repeat of the first example but this time we use white tiling:
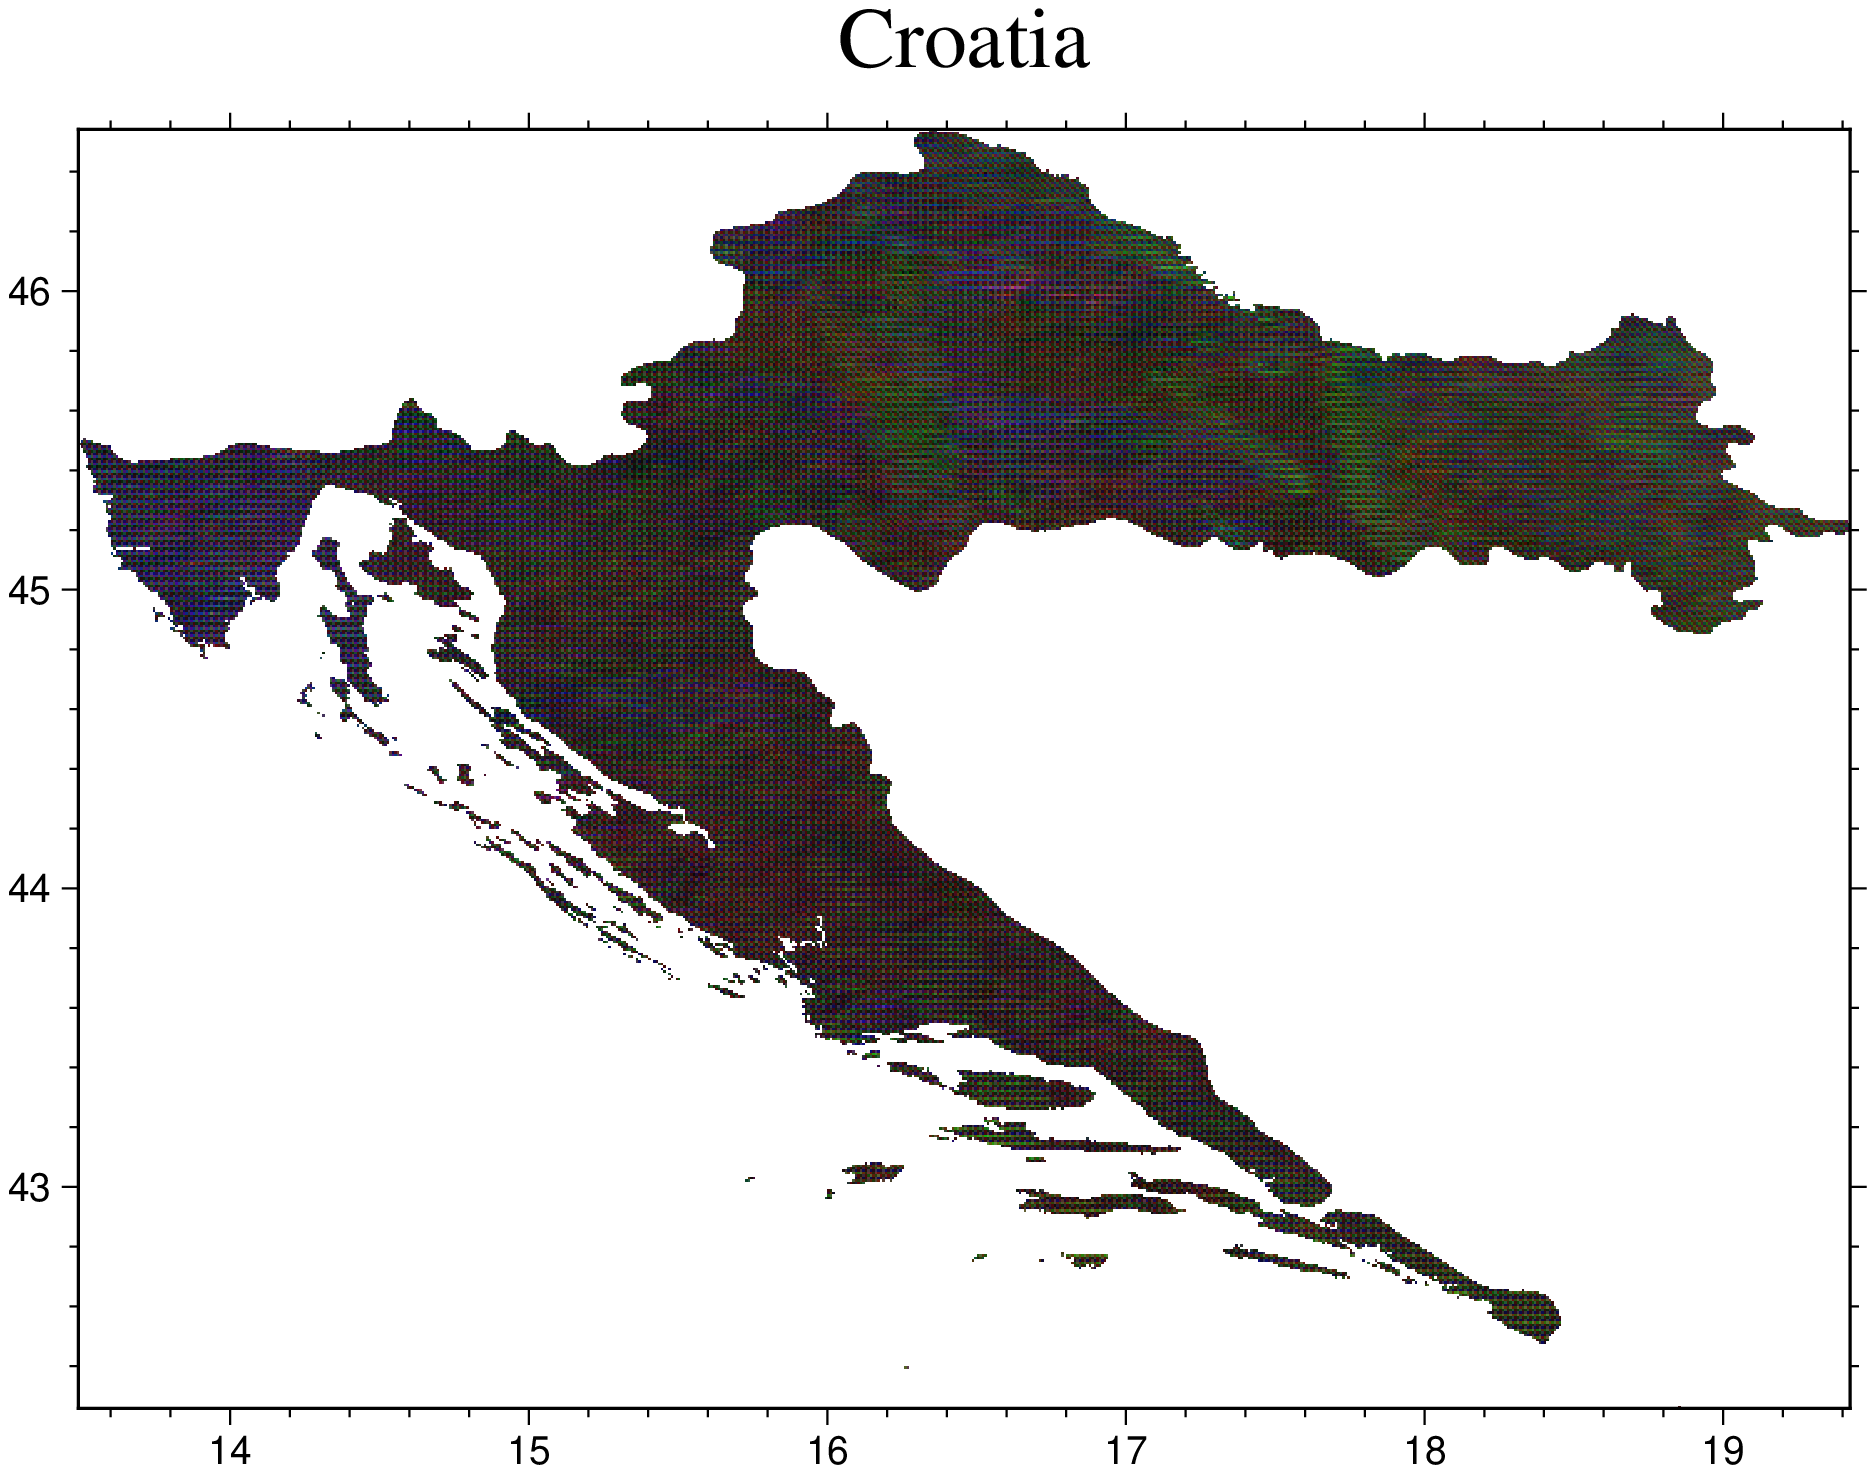
gmt mask africa_grav.xyg -R20/40/20/40 -I5m -JM10i -T -Gwhite -pdf maskusing GMT
D = coast(DCW=:HR, dump=true); # Extract the Croatia border from the DCW
I = gmtread("@earth_day_30s", region=D, V=:q); # Load Earth image containing Croatia
Ic = mask(I, D); # Mask outside (make image transparent there)
gmtwrite("Ic.tiff", Ic) # For now we need to save and reload to see
Ic = gmtread("Ic.tiff"); # the tranparency in action.
viz(Ic, title="Croatia")
See Also
grdmask, surface, basemap, clip
These docs were autogenerated using GMT: v1.33.1