solar
solar(cmd0::String="", arg1=[]; kwargs...)Calculate and plot the day-night terminator and the civil, nautical and astronomical twilights.
Required Arguments
There are no required arguments but either sun or terminators must be selected.
Optional Arguments
B or axes or frame
Set map boundary frame and axes attributes. Default is to draw and annotate left, bottom and vertical axes and just draw left and top axes. More at frame
C or format : format=true
Formats the report selected by sun=?? using tab-separated fields on a single line. The output is Sun Lon Lat Azimuth Elevation in degrees, Sunrise Sunset Noon in decimal days, day length in minutes, SolarElevationCorrected corrected for the effect of refraction index and Equation of time in minutes. Note that if no position is provided in sun=(lon,lat) the data after Elevation refers to the point (0,0).
coast : coast=true | coast=(full coast options list)
When plotting a mapp this option calls the coast module to plot coastlines, rivers, etc... The simple form coast=true will plot the coastlines with a black, 0.5 points thickness, pen. Note, however, that with this option the coastlines are plotted on top of the terminators. If the other way arround is needed, then you must do the usual two calls: coast + solar!
G or fill : fill=color | G=:c
Select color or pattern for filling of terminators; or use G=:c for clipping [Default is no fill]. Deactivate clipping by appending the output ofclipC.
I or sun : sun=true | sun=(lon,lat) | sun=(pos=(lon,lat), date=date) | sun=(pos=(lon,lat), date=date, TZ=tzone)
Print current sun position as well as Azimuth and Elevation. Use sun=(lon,lat) to print also the times of Sunrise, Sunset, Noon and length of the day. To add a date, use a NamedTuple instead and add the element date=date in ISO format, e.g, date="2000-04-25" to compute sun parameters for this date. If necessary, add another element with the time zone via TZ=tzone.
J or proj or projection : – proj=<parameters>
Select map projection. More at proj
M or dump : dump=true
Write terminator(s) as a multisegment file to standard output. No plotting occurs.
N or invert : invert=true
Invert the sense of what is inside and outside the terminator. Only used with clipping (G=:c) and cannot be used together with axes.
R or region or limits : – limits=(xmin, xmax, ymin, ymax) | limits=(BB=(xmin, xmax, ymin, ymax),) | limits=(LLUR=(xmin, xmax, ymin, ymax),units="unit") | ...more
Specify the region of interest. More at limits. For perspective view view, optionally add zmin,zmax. This option may be used to indicate the range used for the 3-D axes. You may ask for a larger w/e/s/n region to have more room between the image and the axes.
T or terminators : terminators="d|c|n|a" | terminators=(term="d|c|n|a", date=date) | terminators=(term="d|c|n|a", date=date), TZ=tzone)
Plot (or dump; see dump) one or more terminators defined via the dcna flags. Where: d means day/night terminator; c means civil twilight; n means nautical twilight; a means astronomical twilight. To add a date, use a NamedTuple instead and add the element date=date in ISO format, e.g, date="2000-04-25" to know where the day-night was at that date. If necessary, add another element with the time zone via TZ=tzone.
U or time_stamp : – time_stamp=true | time_stamp=(just="code", pos=(dx,dy), label="label", com=true)
Draw GMT time stamp logo on plot. More at timestamp
V or verbose : – verbose=true | verbose=level
Select verbosity level. More at verbose
W or pen : pen=pen
Set pen attributes for lines or the outline of symbols [Defaults: width = default, color = black, style = solid].
X or xshift or x_offset : xshift=true | xshift=x-shift | xshift=(shift=x-shift, mov="a|c|f|r")
Shift plot origin. More at xshift
Y or yshift or y_offset : yshift=true | yshift=y-shift | yshift=(shift=y-shift, mov="a|c|f|r")
Shift plot origin. More at yshift
figname or savefig or name : – figname=
name.png
Save the figure with thefigname=name.extwhereextchooses the figure image format.
Examples
Print current Sun position and Sunrise, Sunset times at:
solar(sun=(pos=(-7.93,37.079), date="2016-02-04T10:01:00"))Plot the day-night and civil twilight
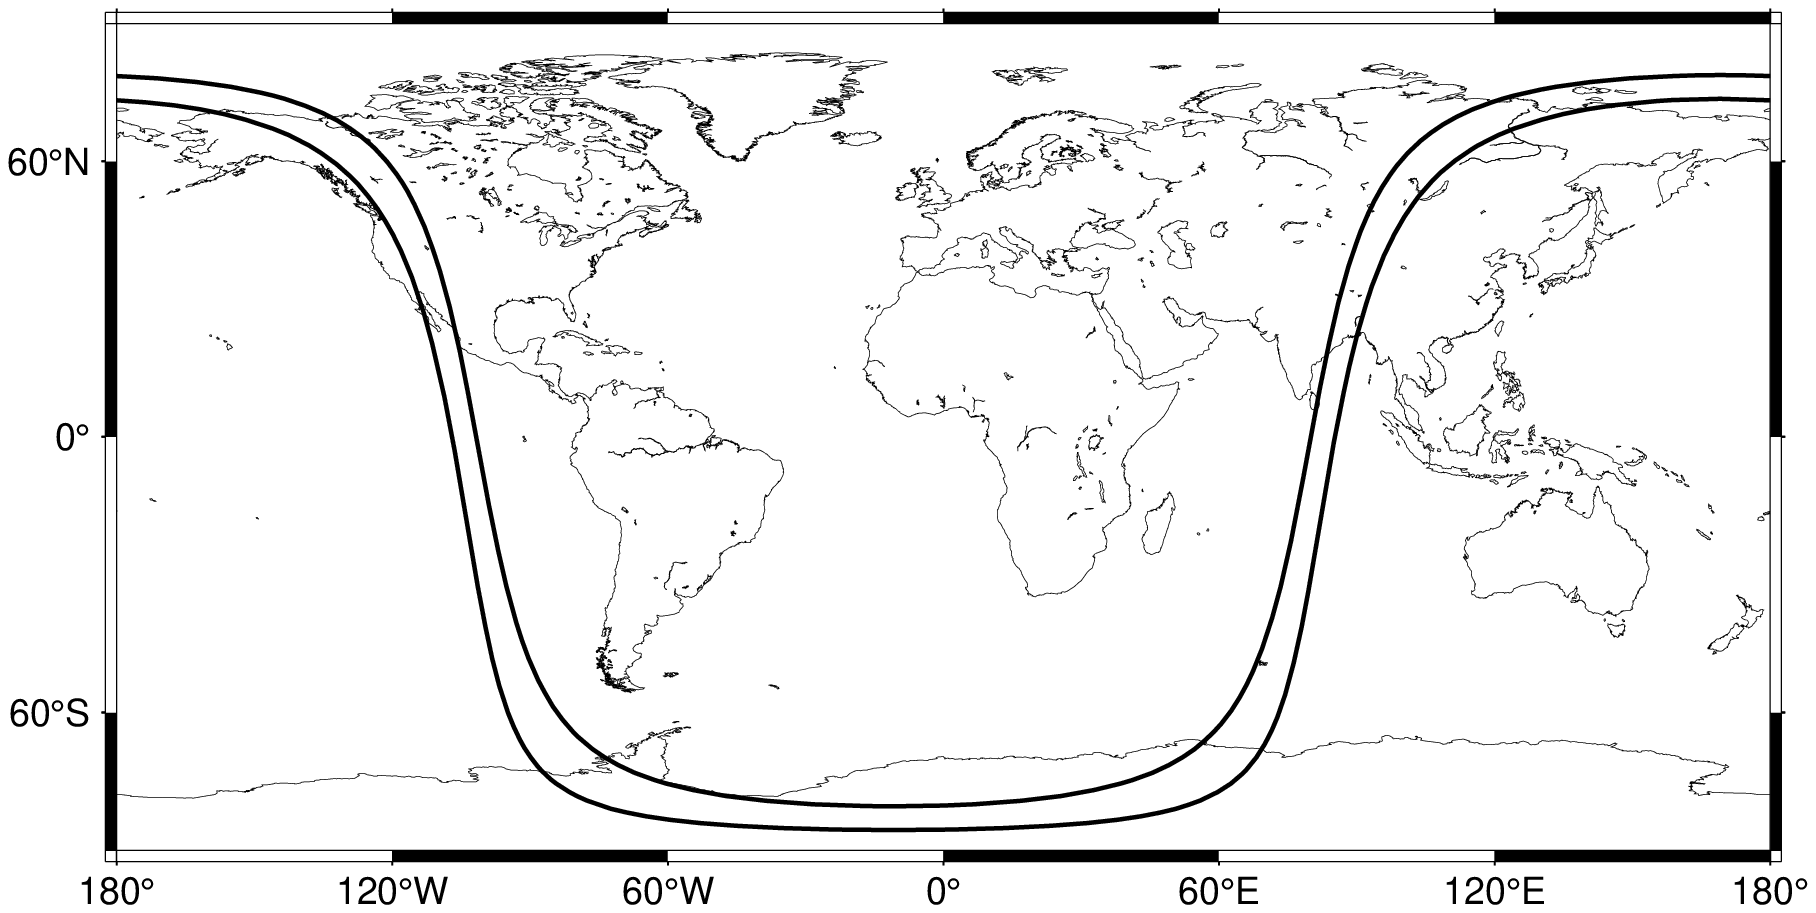
using GMT
coast(region=:d, shore=0.1, proj="Q0/14c", axes=(annot=:auto, axes="WSen"),
      resolution=:low, area=1000)
solar!(pen=1, terminators="dc", show=true)
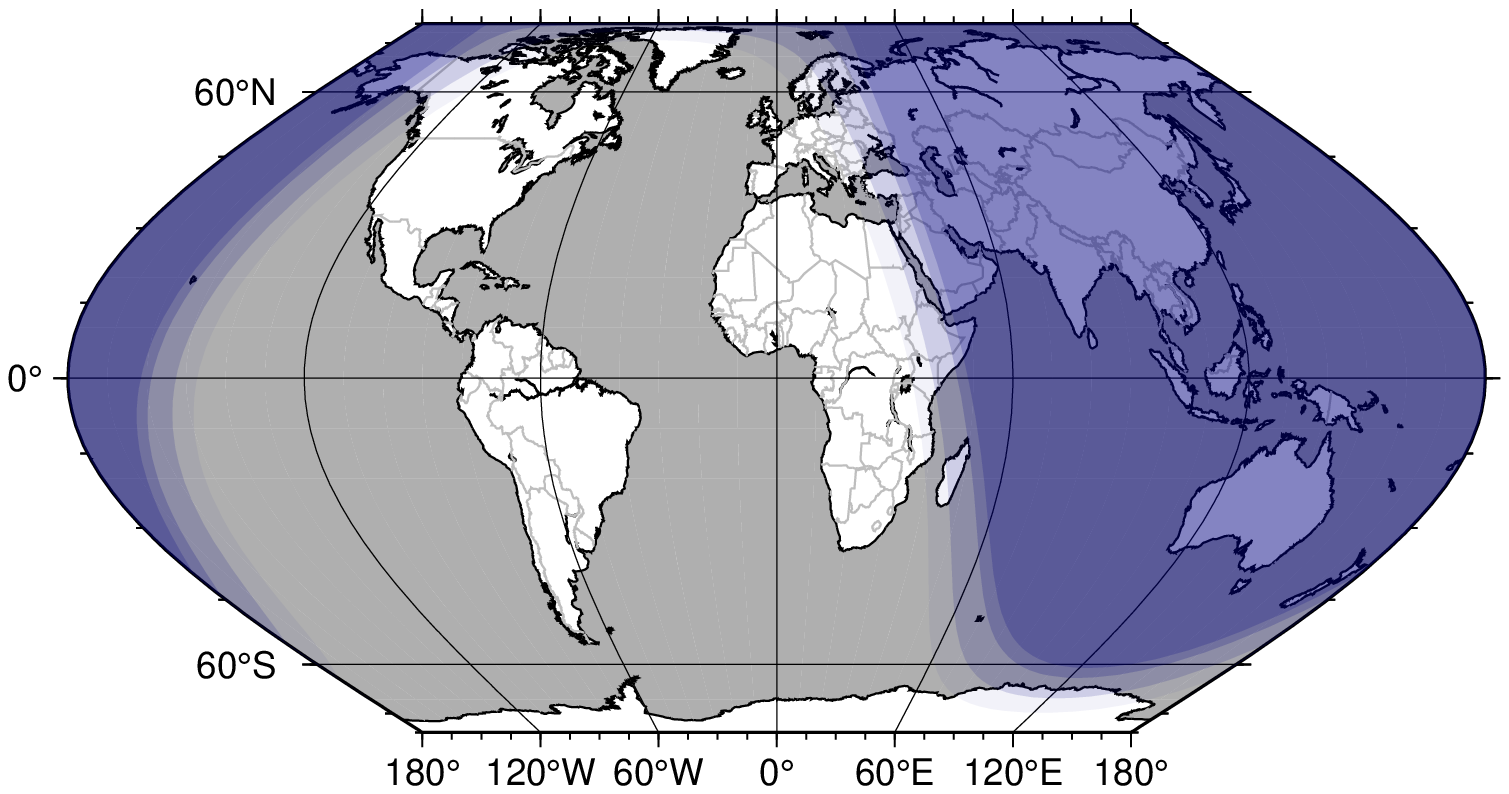
But it is much nicer if we paint the terminators
using GMT
coast(region=:d, proj="Ks0/12", resolution=:low, area=5000, borders="1/0.5p,gray",
      water=(175,210,255), axes=(annot=:a,ticks=:a,grid=:a), shore=0.5)
solar!(terminators=(term=:d, date="2016-02-09T16:00:00"), fill="navy@95")
solar!(terminators=(term=:c, date="2016-02-09T16:00:00"), fill="navy@85")
solar!(terminators=(term=:n, date="2016-02-09T16:00:00"), fill="navy@80")
solar!(terminators=(term=:a, date="2016-02-09T16:00:00"), fill="navy@80", show=true)
See also
The GMT man page
These docs were autogenerated using GMT: v1.33.1