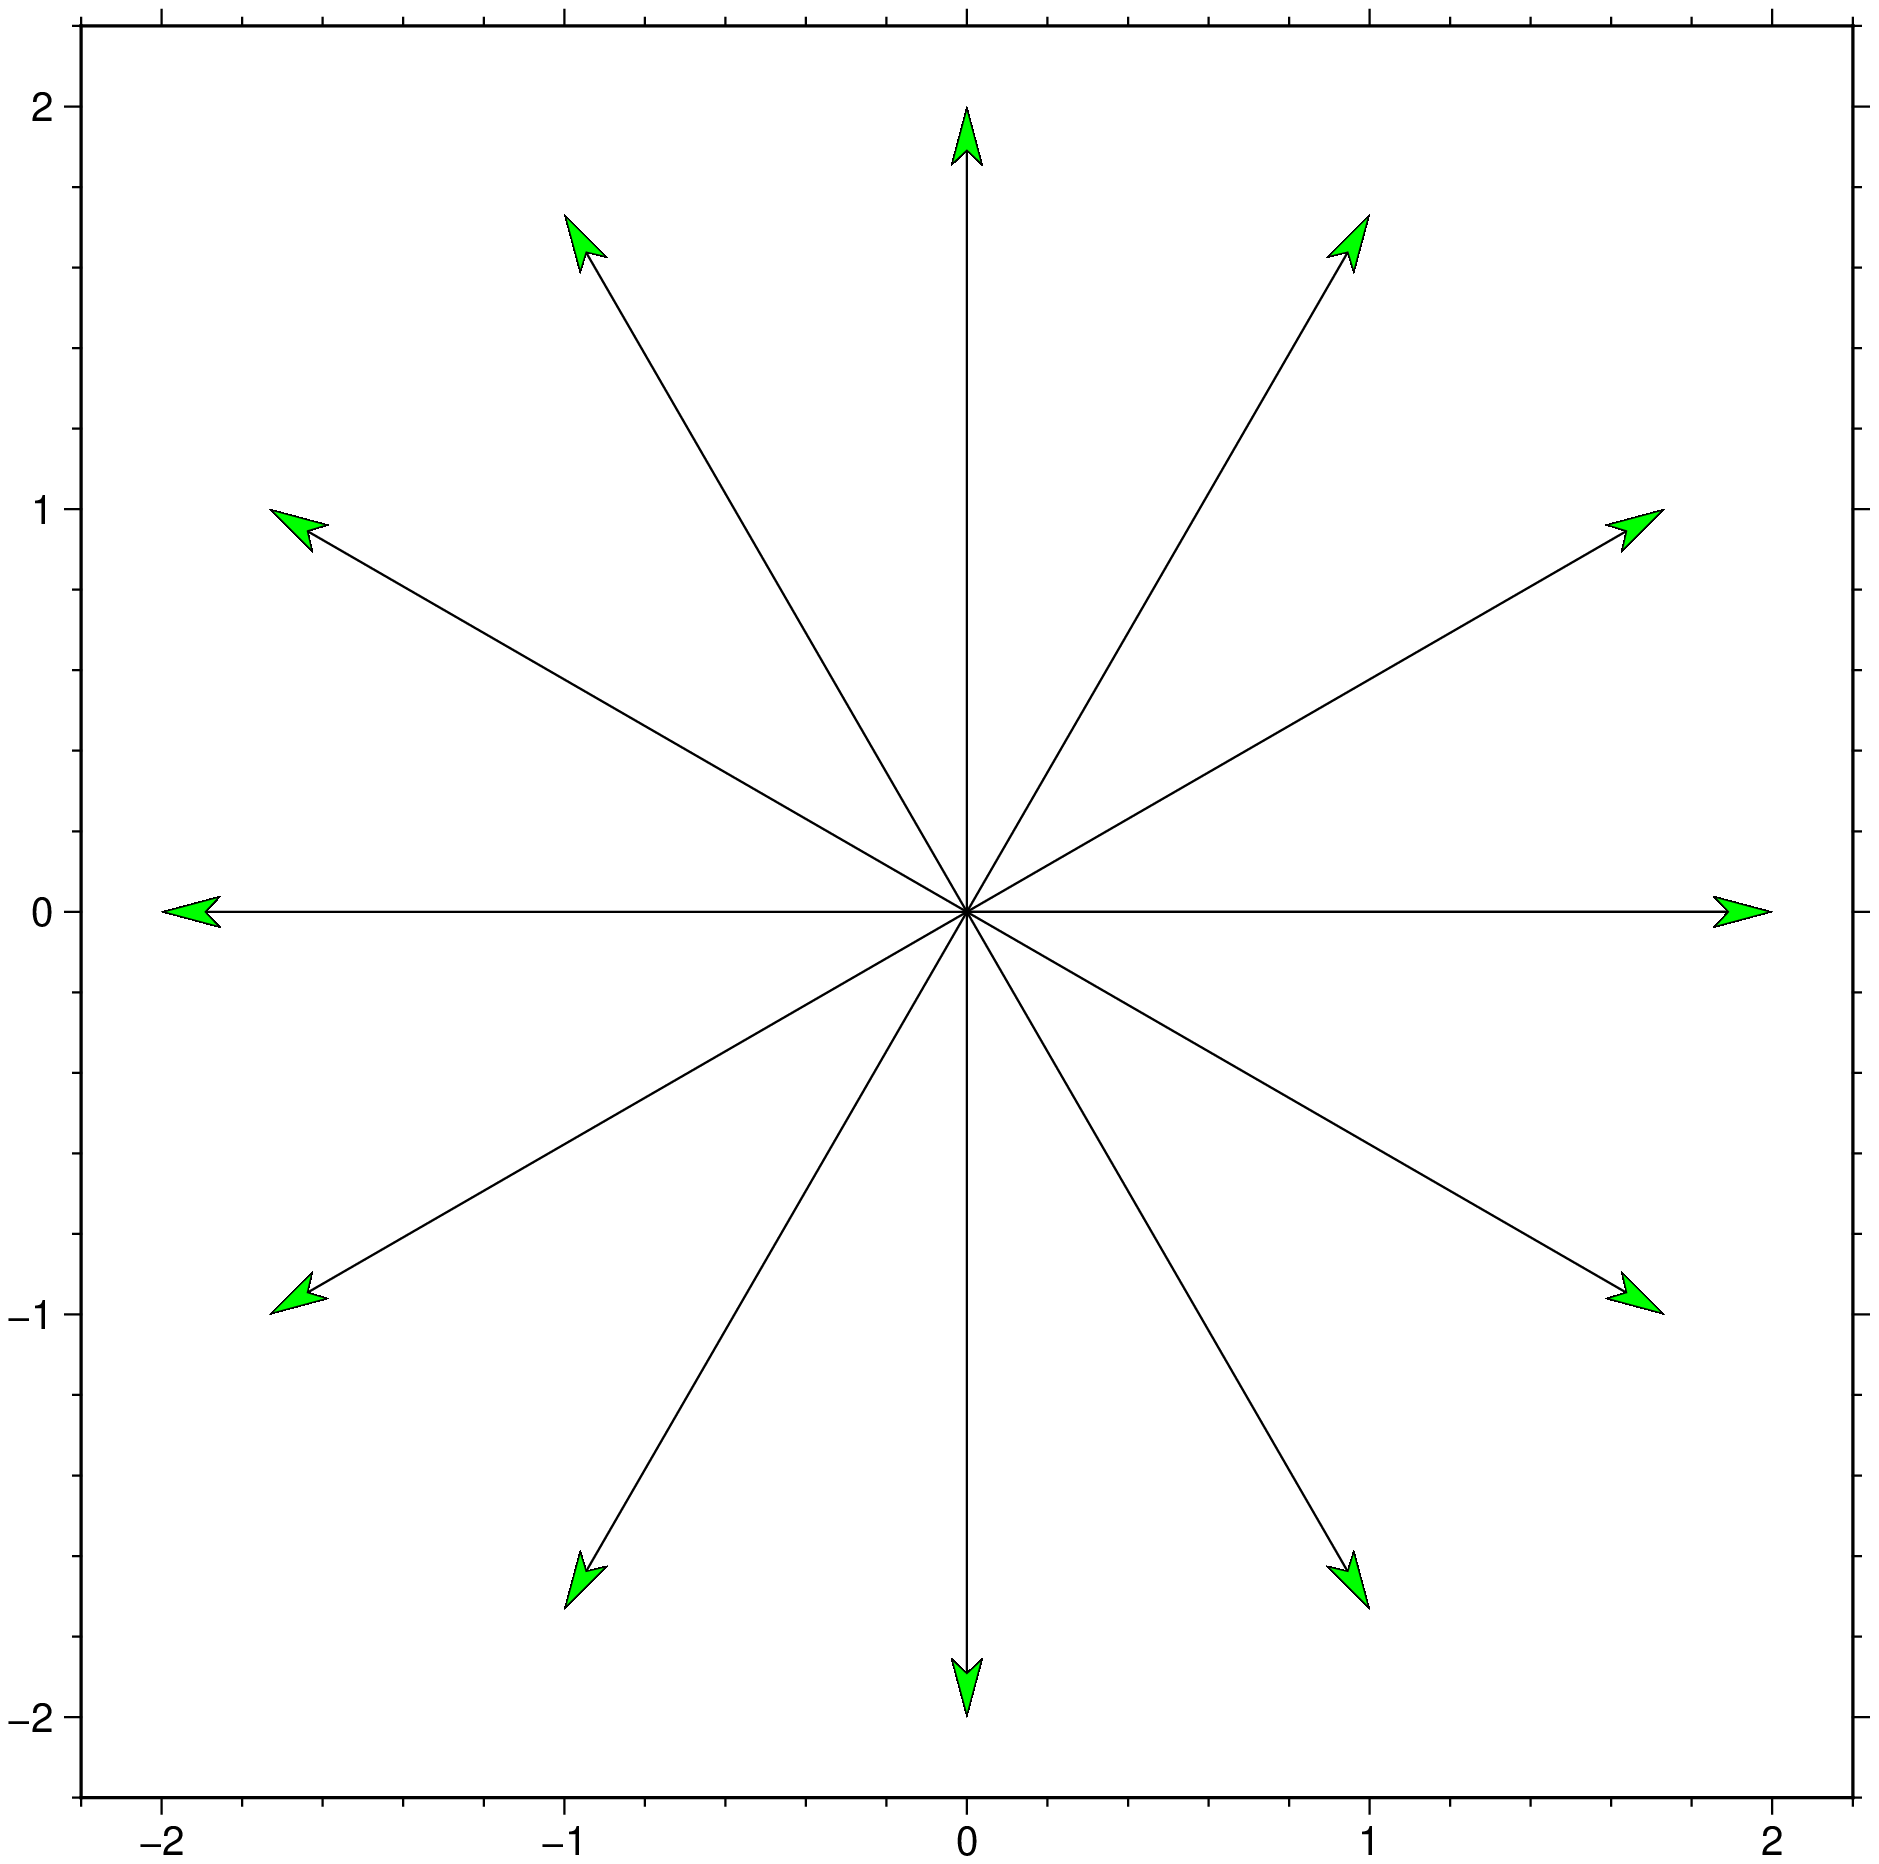
Feathers
uv = [0.0 0 2.0; 0.0 30 2; 0.0 60 2; 0.0 90 2; 0.0 120 2; 0.0 150 2; 0.0 180 2; 0.0 210 2; 0.0 240 2; 0.0 270 2; 0.0 300 2; 0.0 330 2; 0.0 360 2]using GMT
uv = [0.0 0 2.0; 0.0 30 2; 0.0 60 2; 0.0 90 2; 0.0 120 2; 0.0 150 2; 0.0 180 2; 0.0 210 2; 0.0 240 2; 0.0 270 2; 0.0 300 2; 0.0 330 2; 0.0 360 2];
feather(uv, rtheta=true, aspect="1:1", arrow=(len=0.5, shape=0.5,),
lw=0.5, fill=:green, show=true)
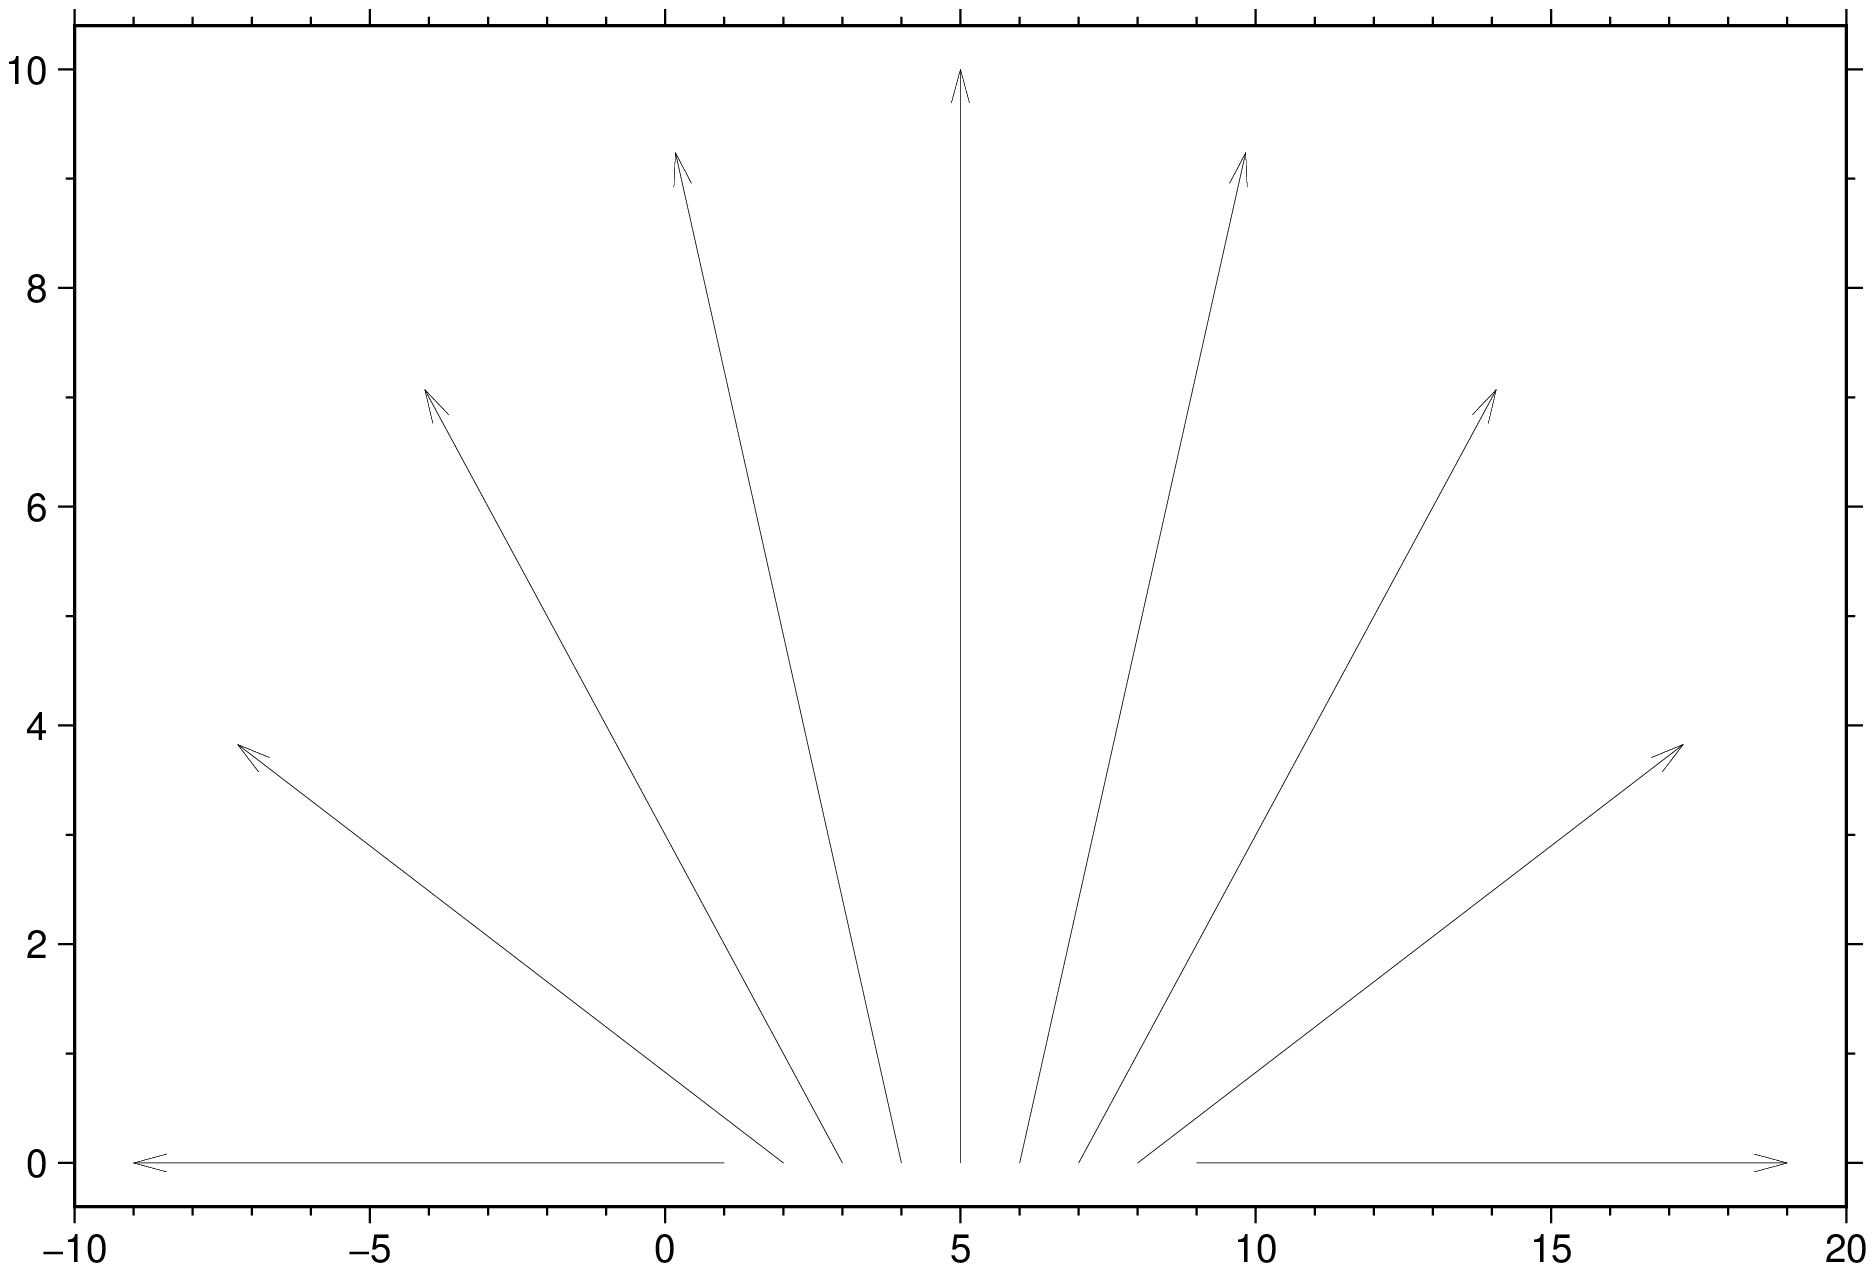
Simple arrows and in function of number of arrows.
using GMT
t = -pi/2:pi/8:pi/2; u = 10*sin.(t); v = 10*cos.(t);
feather(u,v, show=true)
Show the data used in this example.
D = gmtread(TESTSDIR * "assets/wind_faro_s.dat")| Time | azimuth | vmean | vmax |
|---|---|---|---|
| 1.4936e9 | 310.0 | 2.4 | 3.6 |
| 1.4936e9 | 328.0 | 2.5 | 4.3 |
| 1.4936e9 | 340.0 | 2.0 | 4.2 |
| 1.49361e9 | 26.0 | 1.3 | 3.5 |
| 1.49361e9 | 350.0 | 2.8 | 5.7 |
| 1.49361e9 | 349.0 | 2.7 | 6.6 |
| 1.49362e9 | 337.0 | 1.9 | 3.9 |
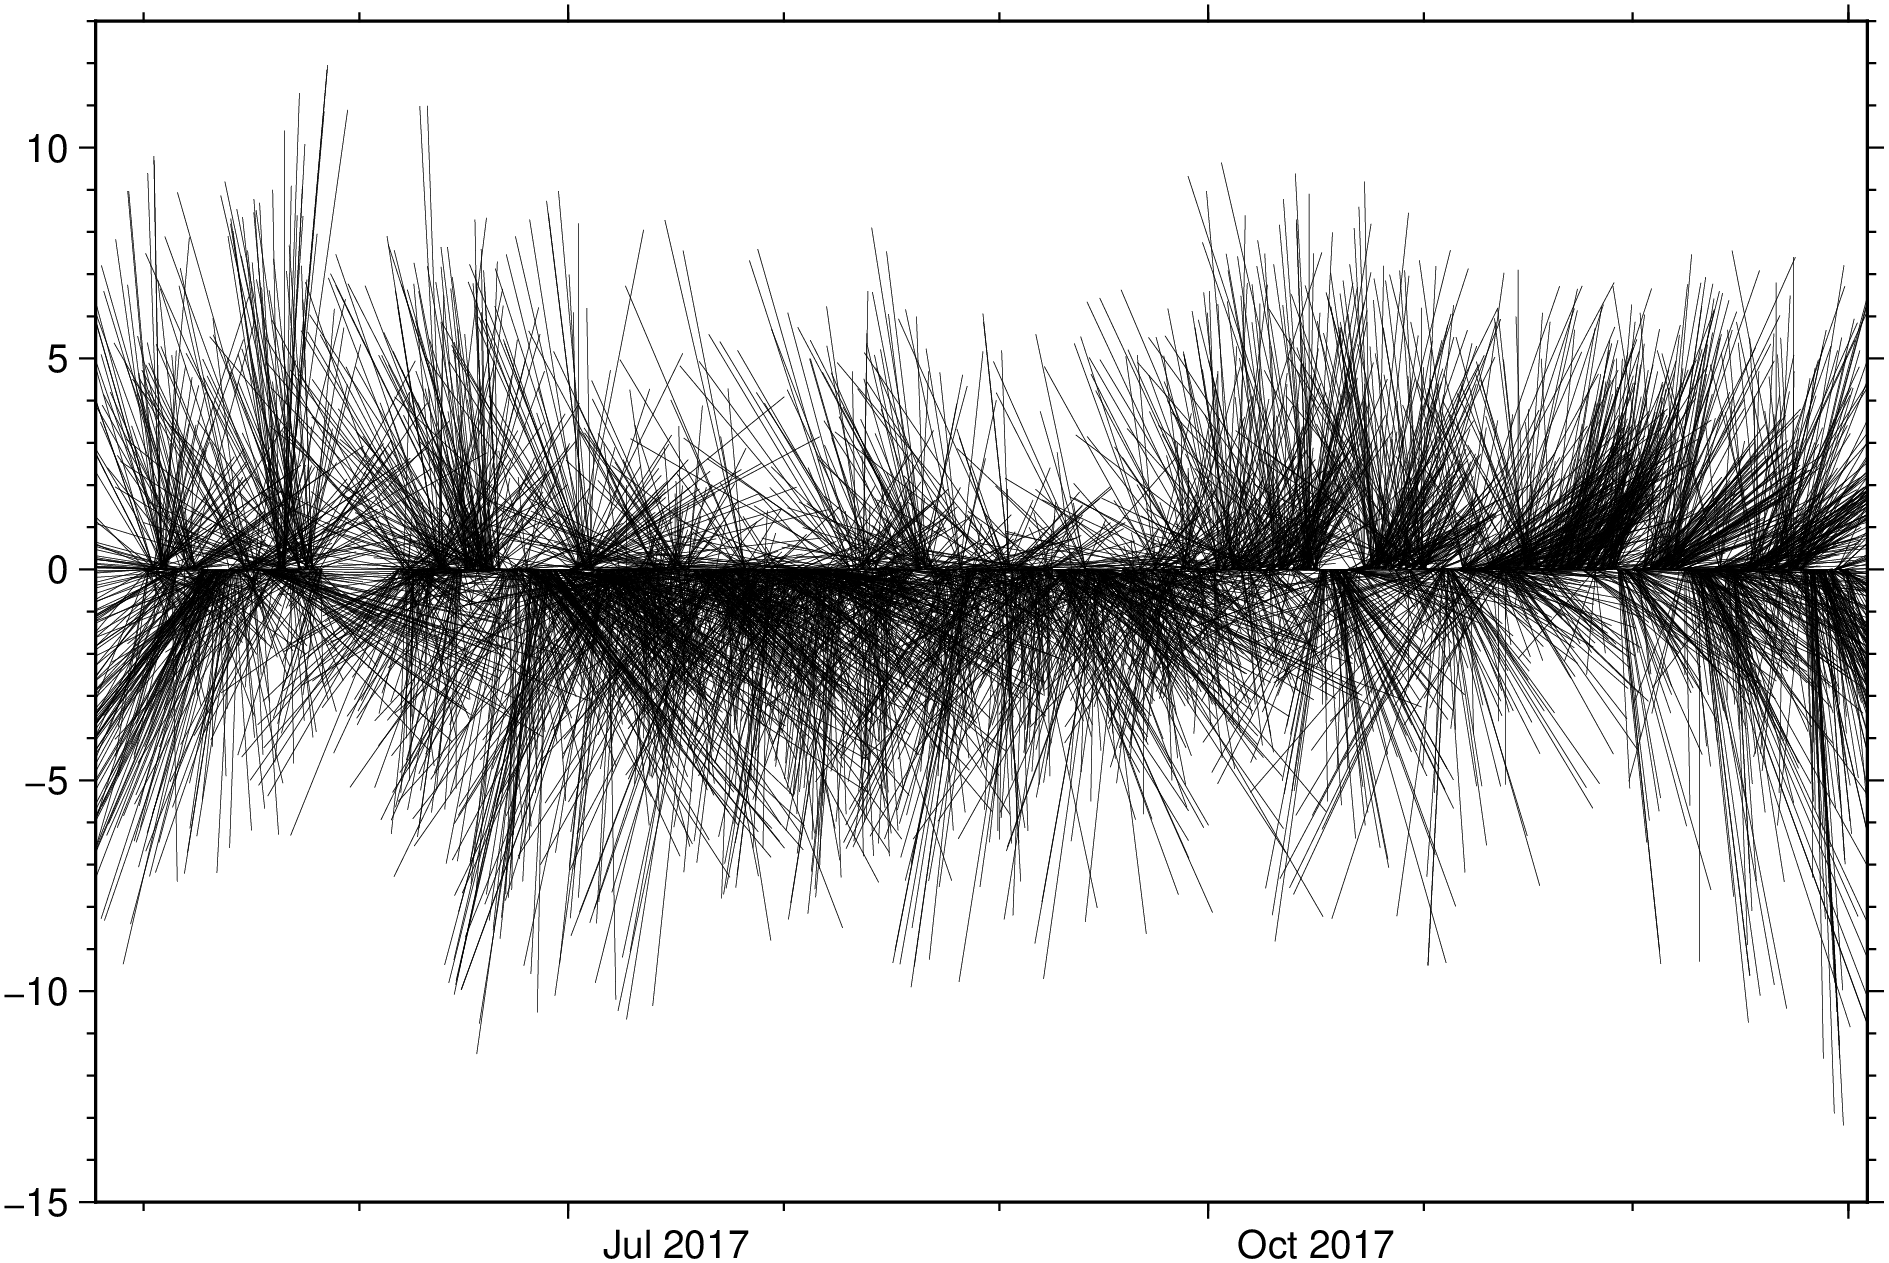
Create a winbarb plot. Note that since the data has 4 columns we must select the 3 that we want to use in the plot. We select the columns from teir names in the DGMTdataset.
using GMT
feather(TESTSDIR * "assets/wind_faro.dat", xvar=:Time, yvar=[:azimuth, :vmean],
        rtheta=true, nohead=1, lw=0.1, show=true)
© GMT.jl. Last modified: November 06, 2025. Website built with Franklin.jl and the Julia programming language.
These docs were autogenerated using GMT: v1.33.1