Plot surfaces
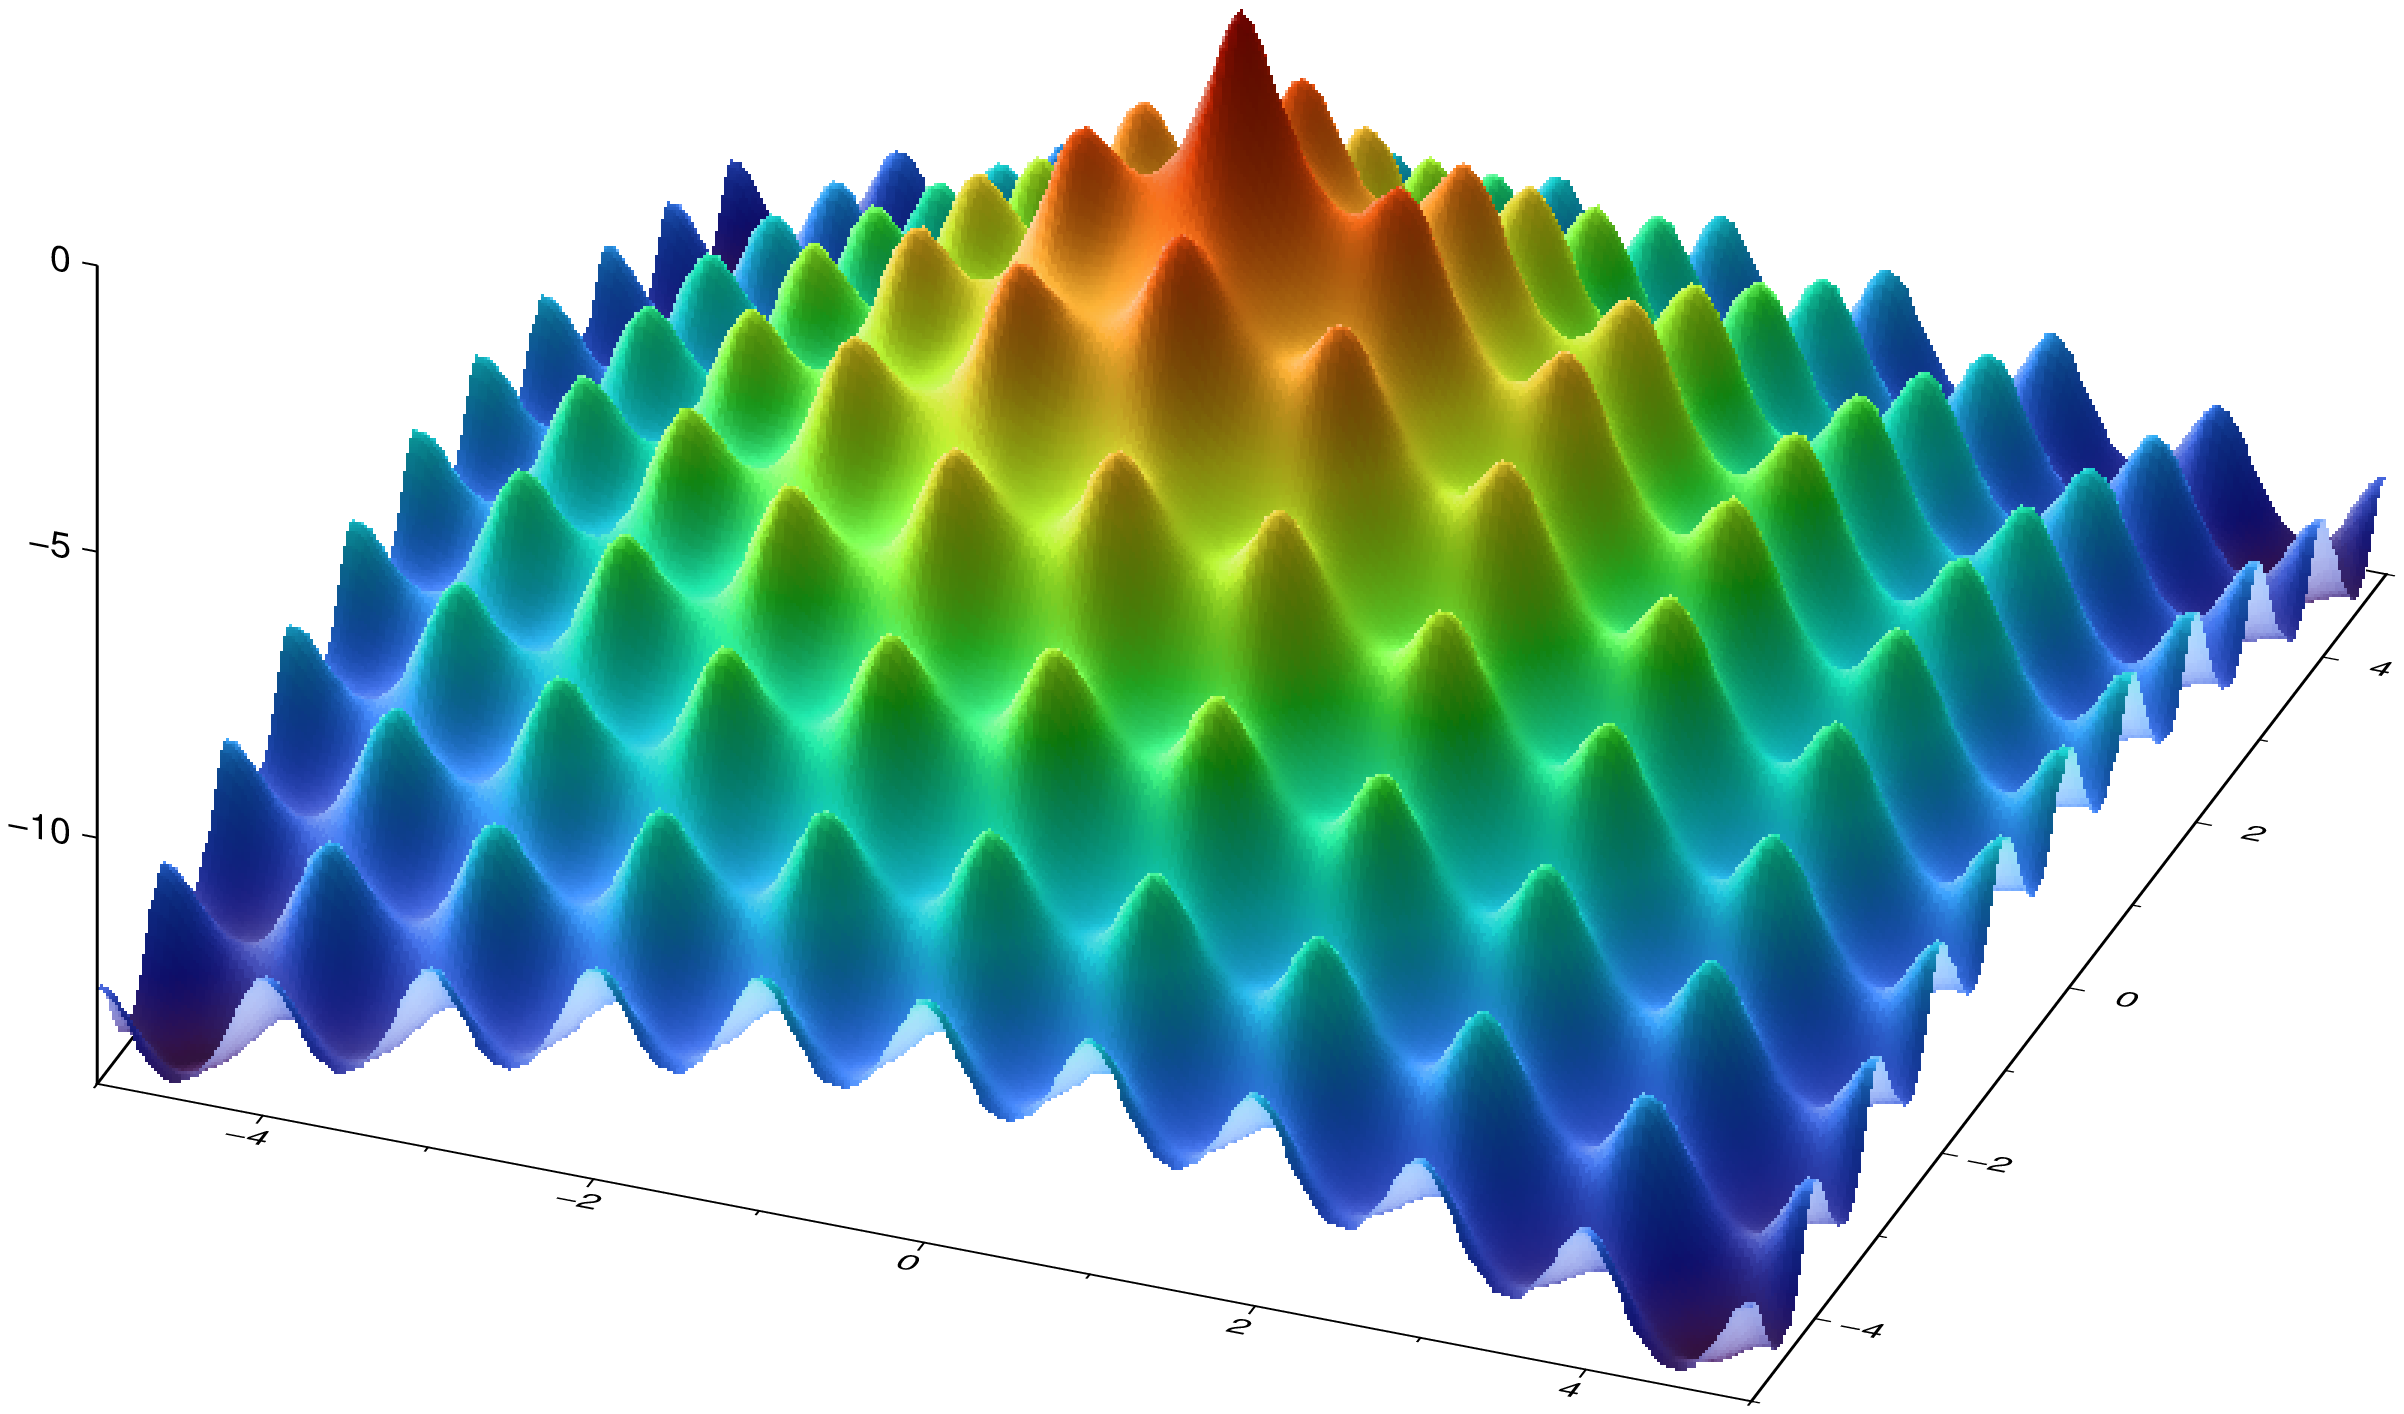
Ackley
grdview can plot 3-D surfaces with them provided as grids or as function equations or some predefined function names. Note that the view option controls the azimuth and elevation angle of the view.
There are a couple of predefined functions that can plotted for demonstration purposes. For example the ackley function
using GMT
imshow("ackley", view=(159,30), shade=true)
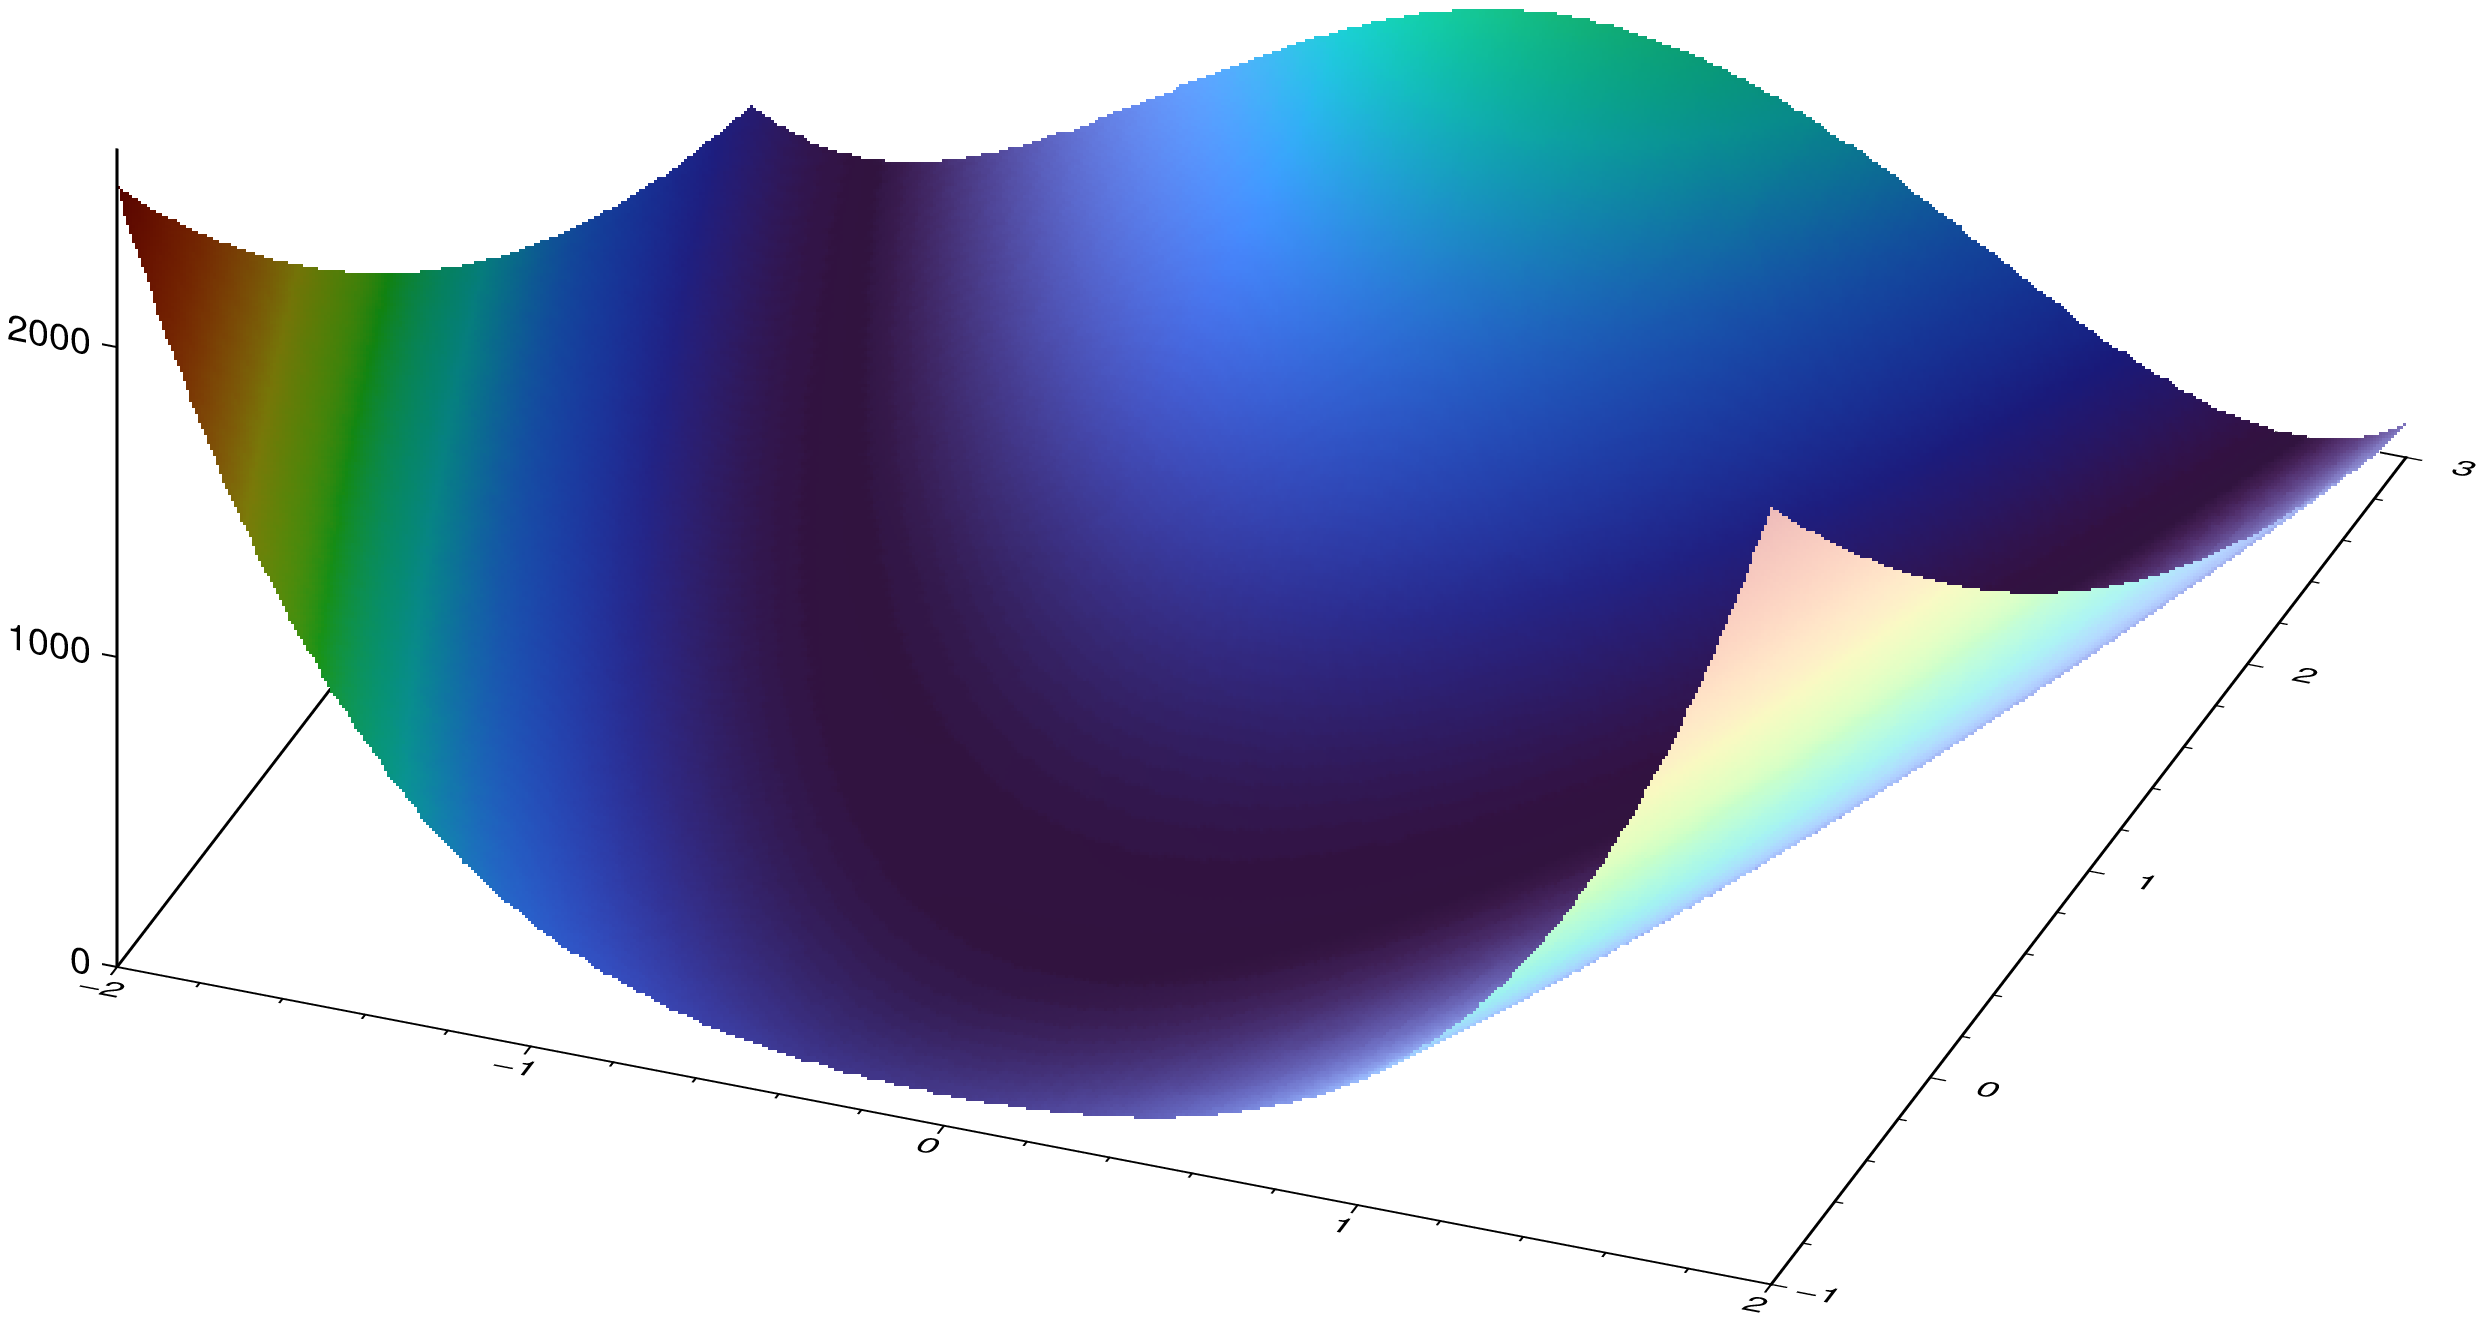
Rosenbrock
Or the rosenbrock that looks like a manta ray (other options are parabola, eggbox, sombrero)"
using GMT
imshow("rosenbrock", view=(159,30), shade=true)
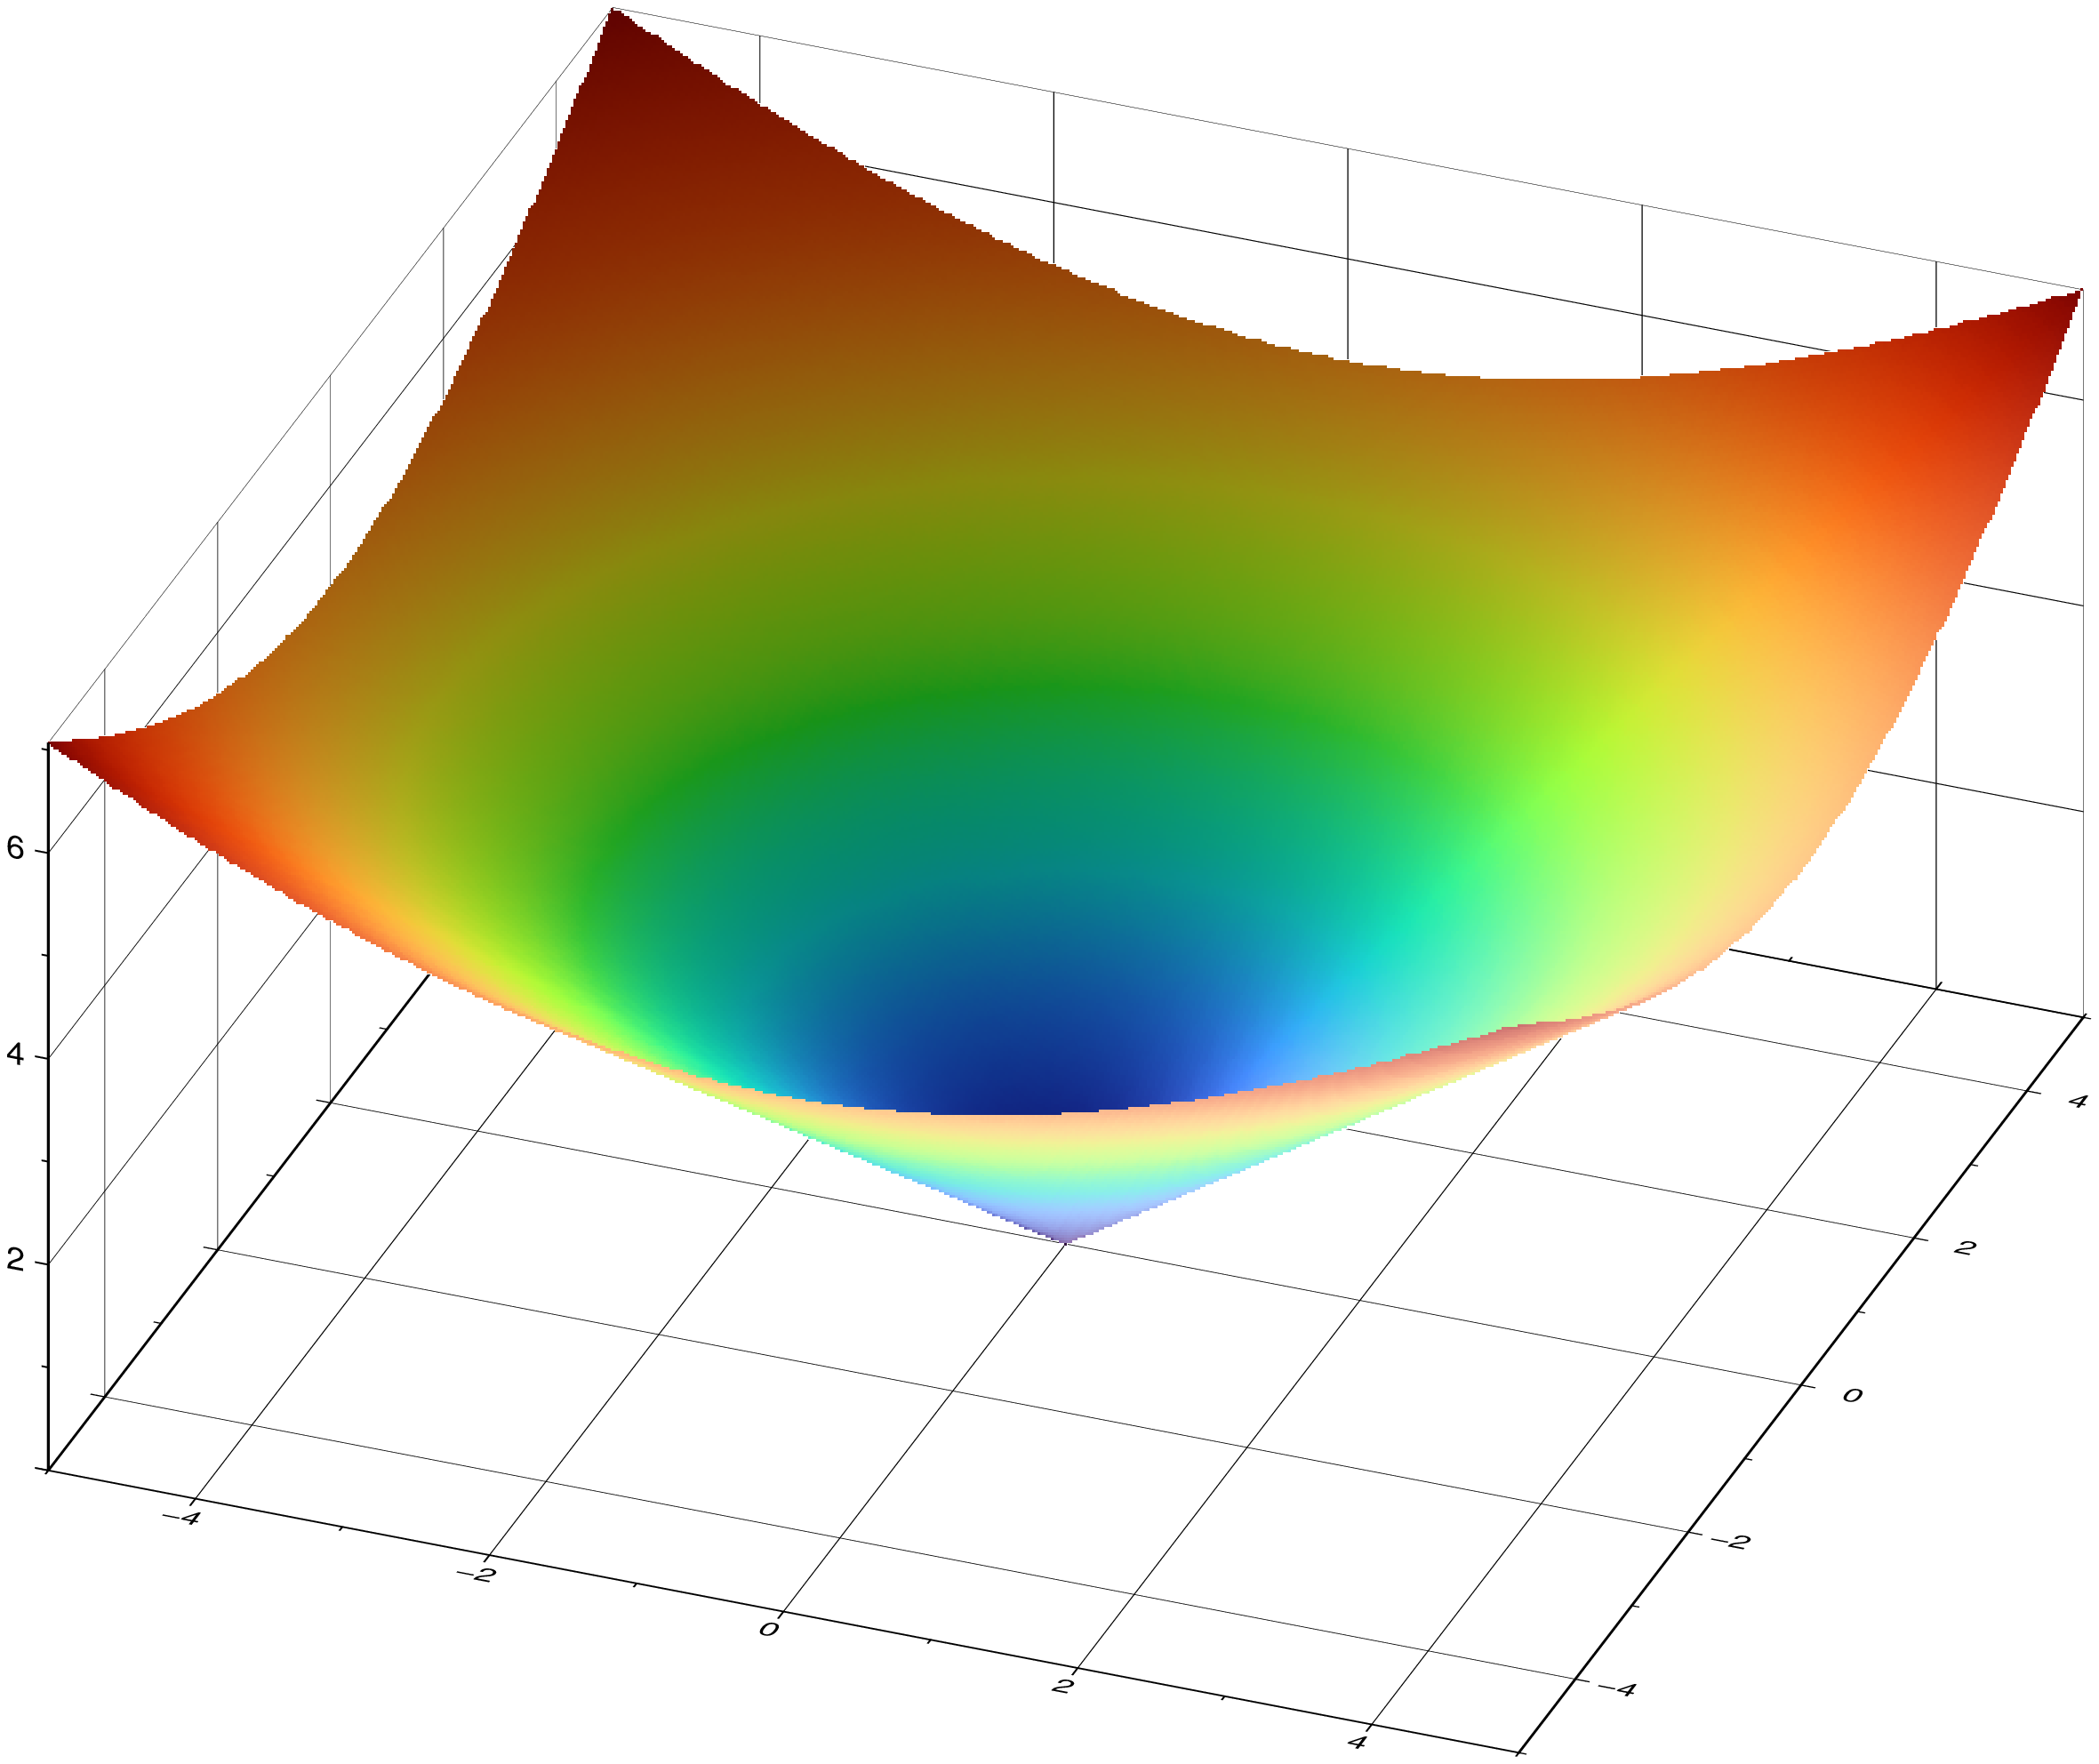
But besides these predefined functions one can any function that defines a surface. For example a parabola can be plotted with the code bellow. First argument can be an anonymous function (like the example) of a function. Second and third args contain the plotting domain and step used to evaluate the function.
using GMT
imshow((x,y) -> sqrt(x^2 + y^2), -5:0.05:5, -5:0.05:5, view=(159,30), shade=true, frame=:autoXYZg)
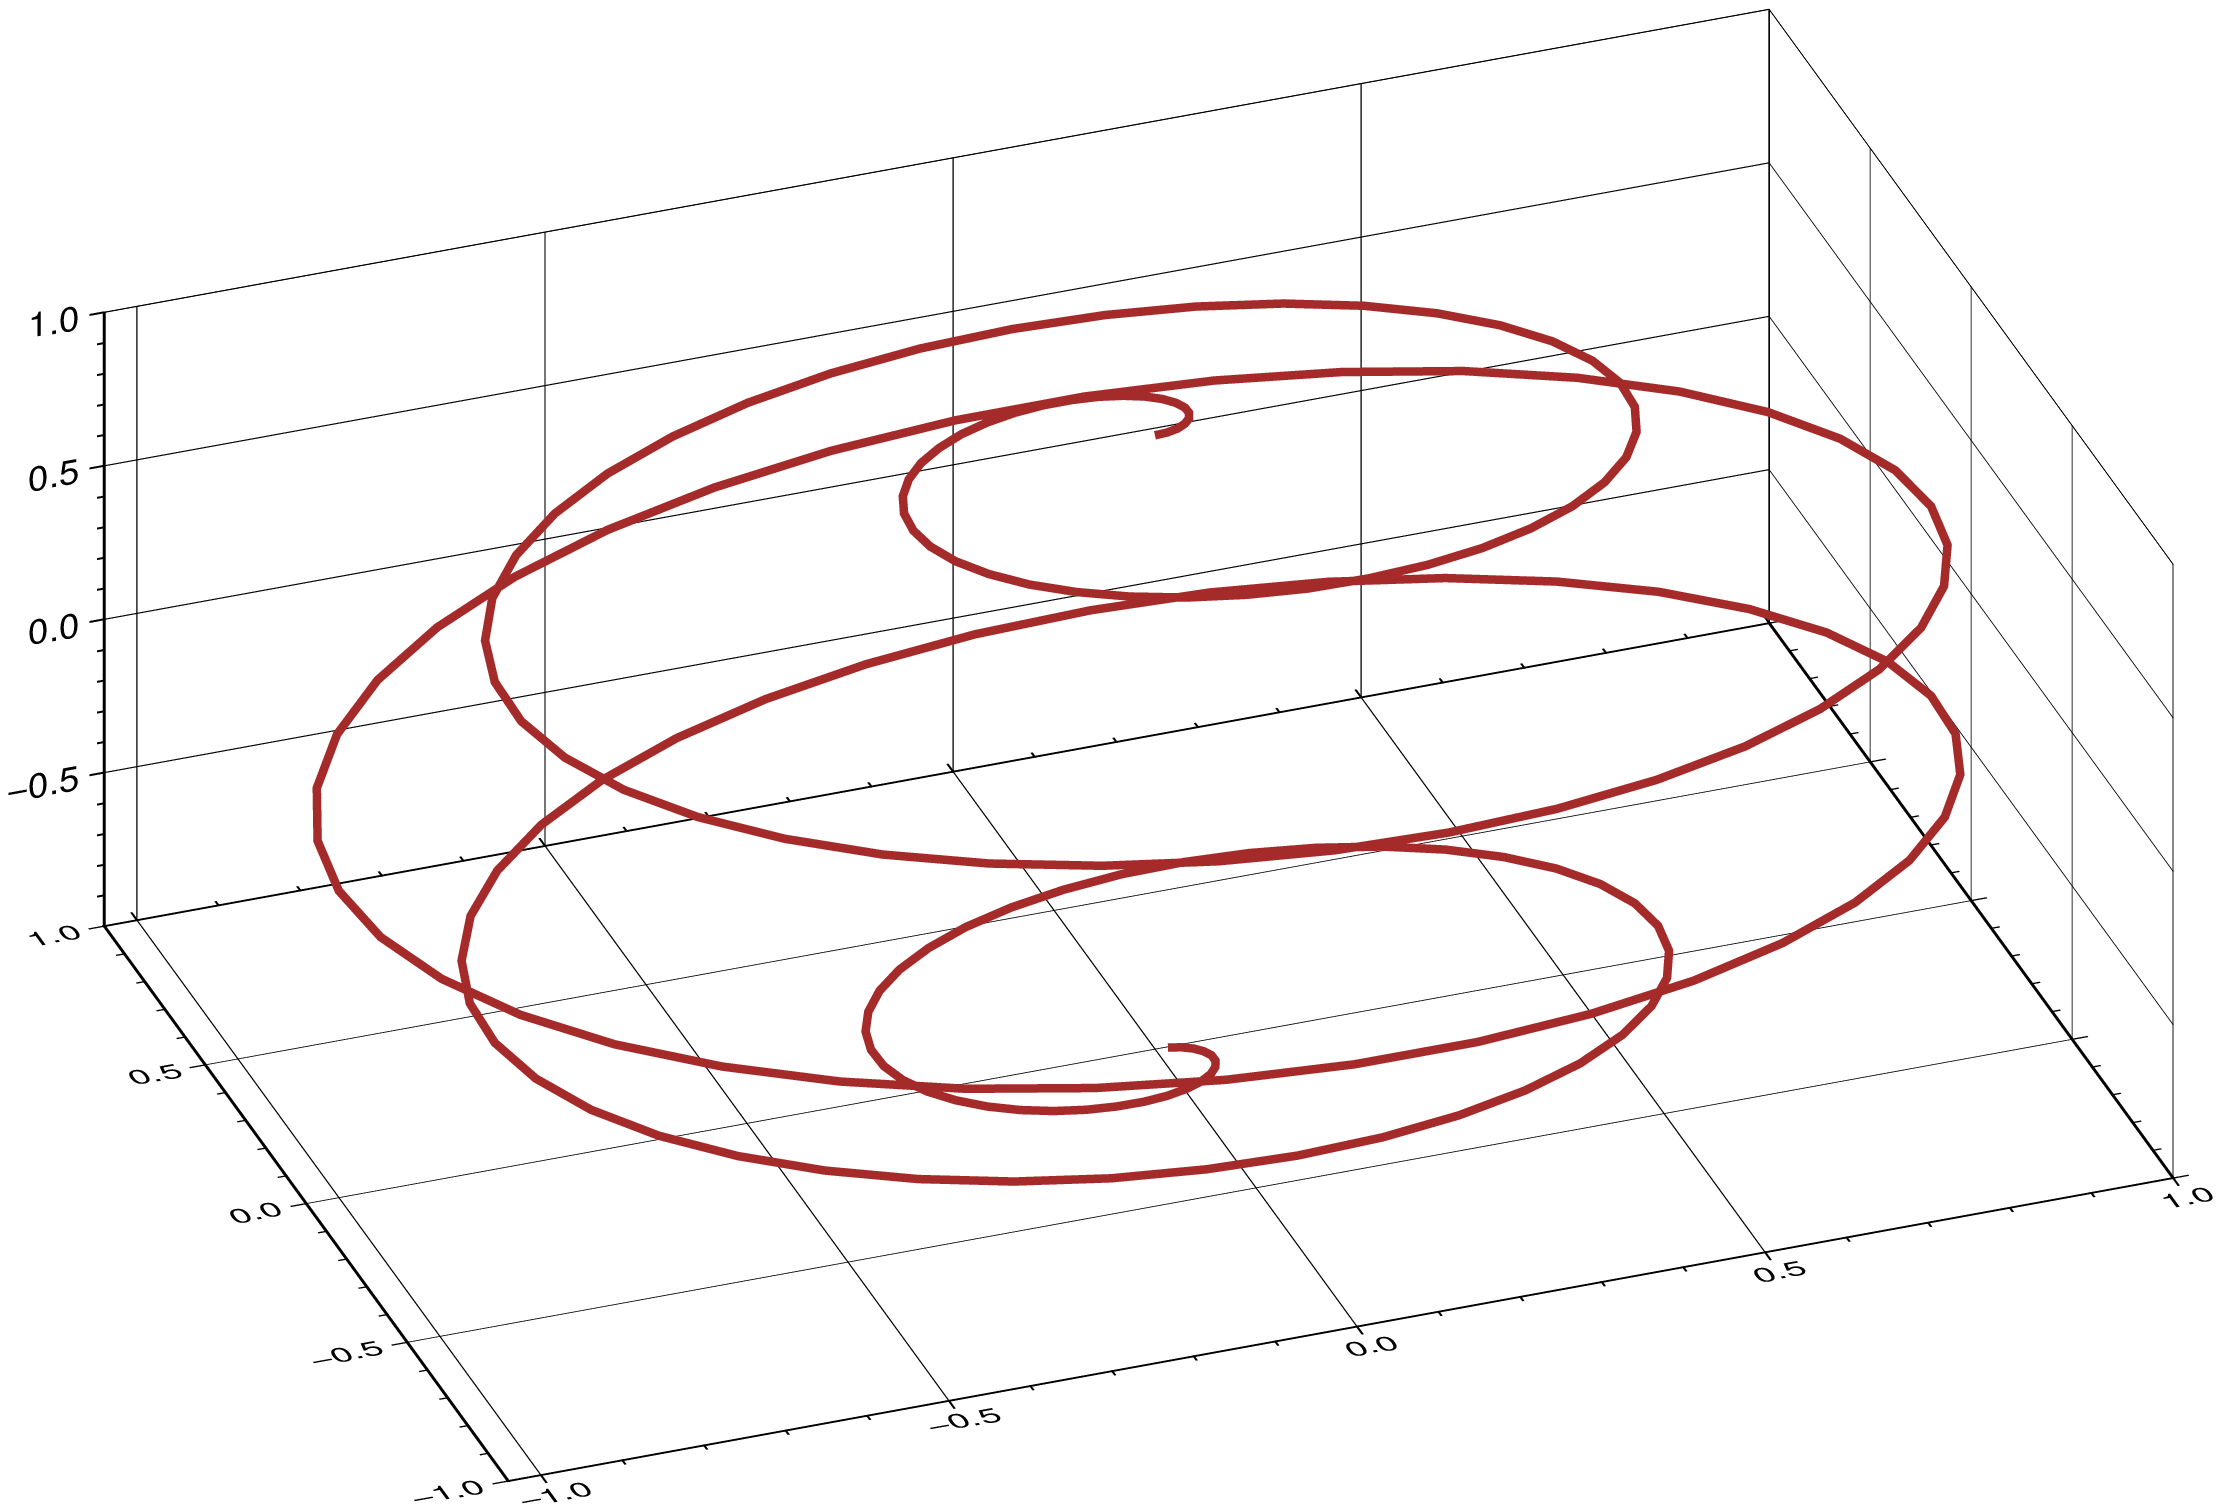
And we can plot 3D lines too. Same thing, give a parametric equation and
using GMT
plot3d(x -> sin(x)*cos(10x), y -> sin(y)*sin(10y), z -> cos(z), 0:pi/200:pi, lt=2, lc=:brown, frame=:autoXYZg, show=true)
These docs were autogenerated using GMT: v1.33.1