Scatters
Examples
Using x and y vectors
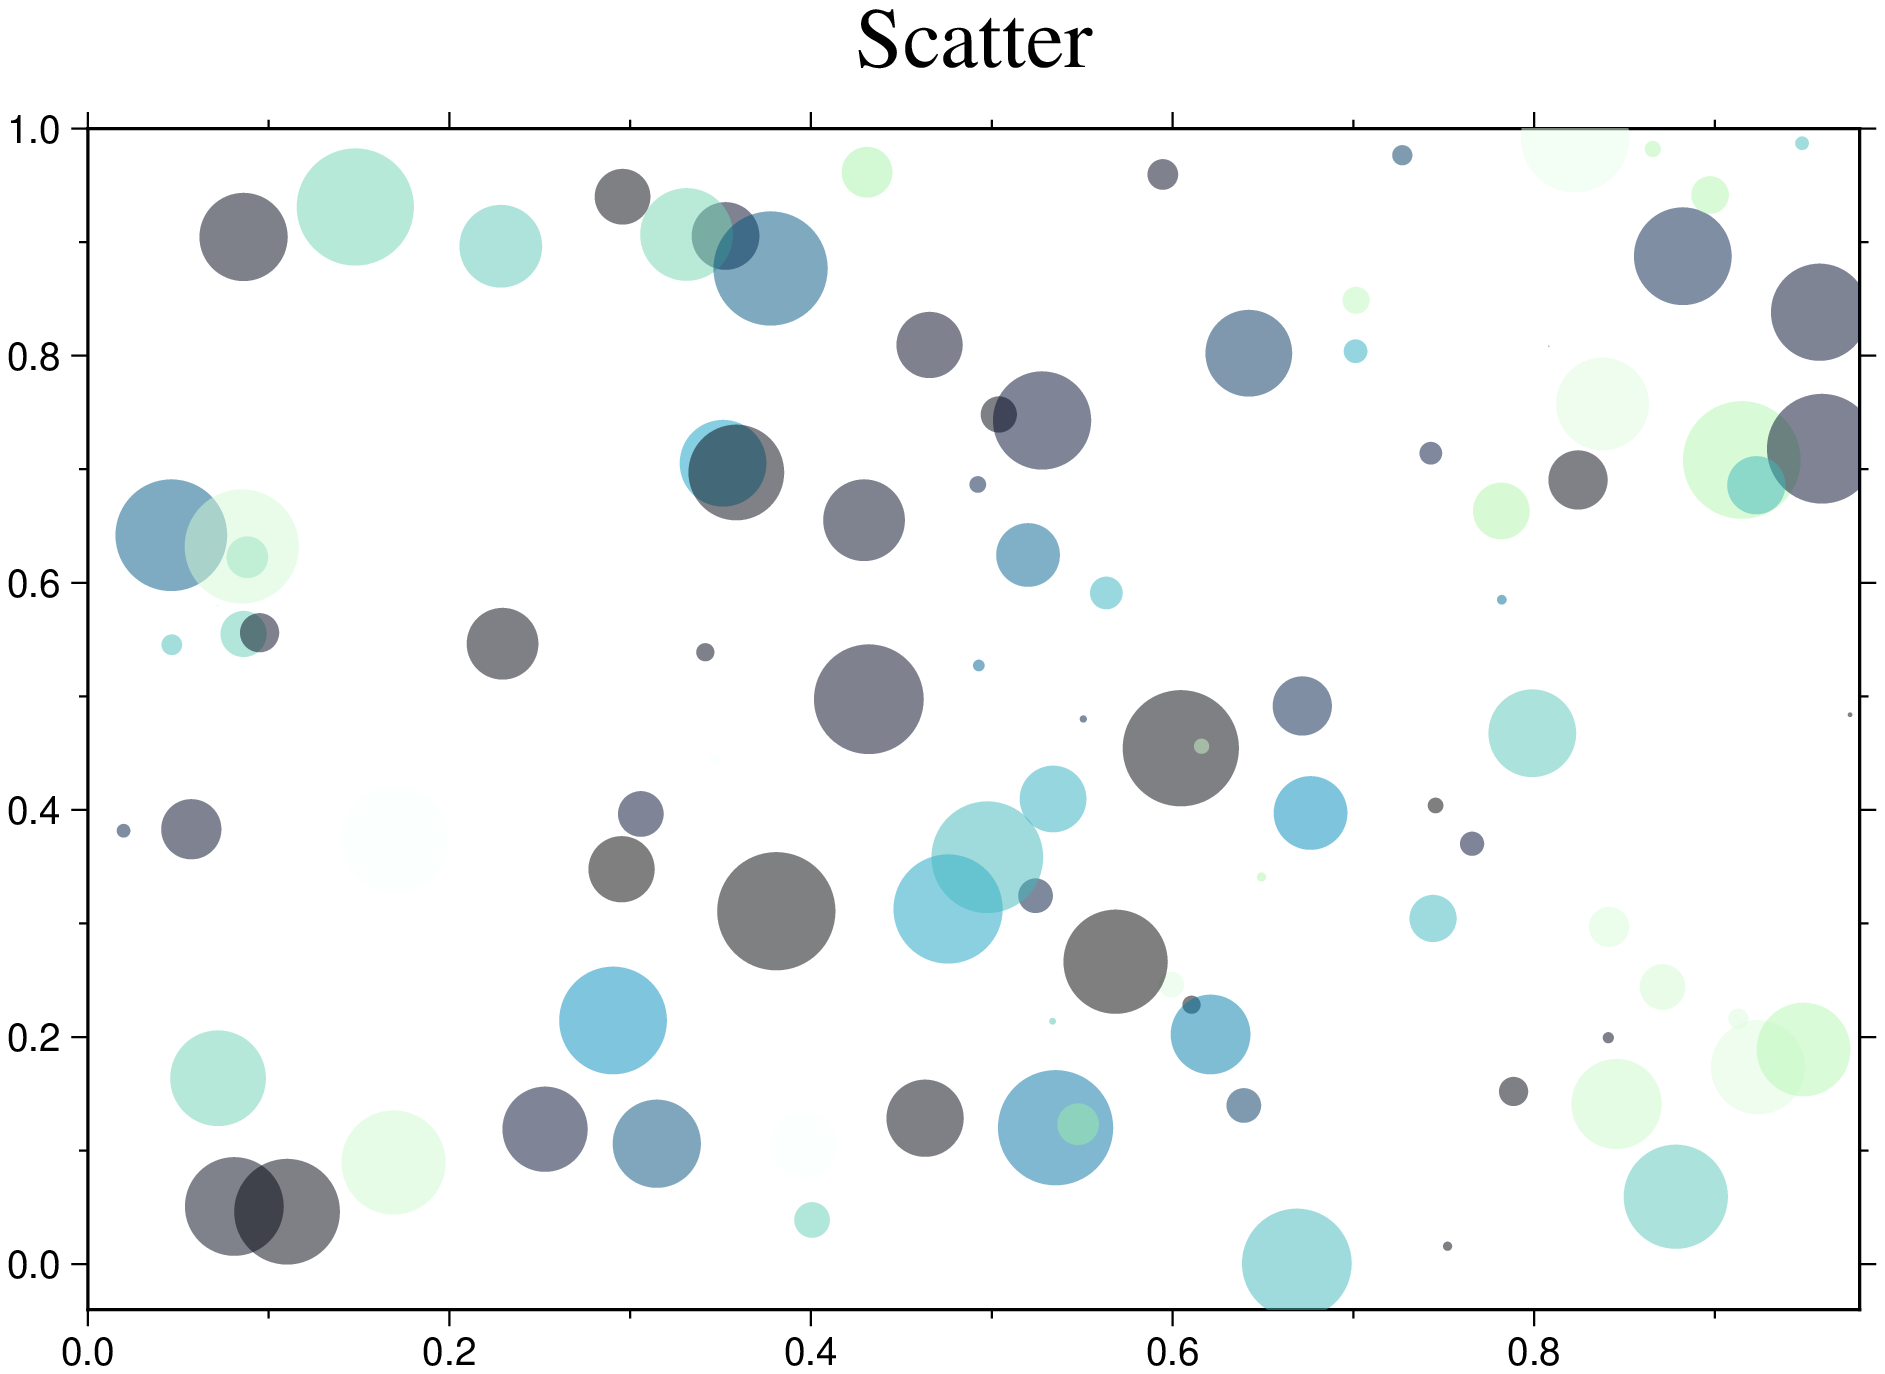
Draw a Cartesian scatter plot with variable symbol size, color and transparency
using GMT
scatter(rand(100),rand(100),   # Generate data
        markersize=rand(100),  # Symbol sizes
        marker=:c,             # Plot circles
        color=:ocean,          # Color scale
        zcolor=rand(100),      # Assign color to each symbol
        alpha=50,              # Set transparency to 50%
        title="Scatter",       # Fig title
        show=true)             # Display the figure
Polar scatter
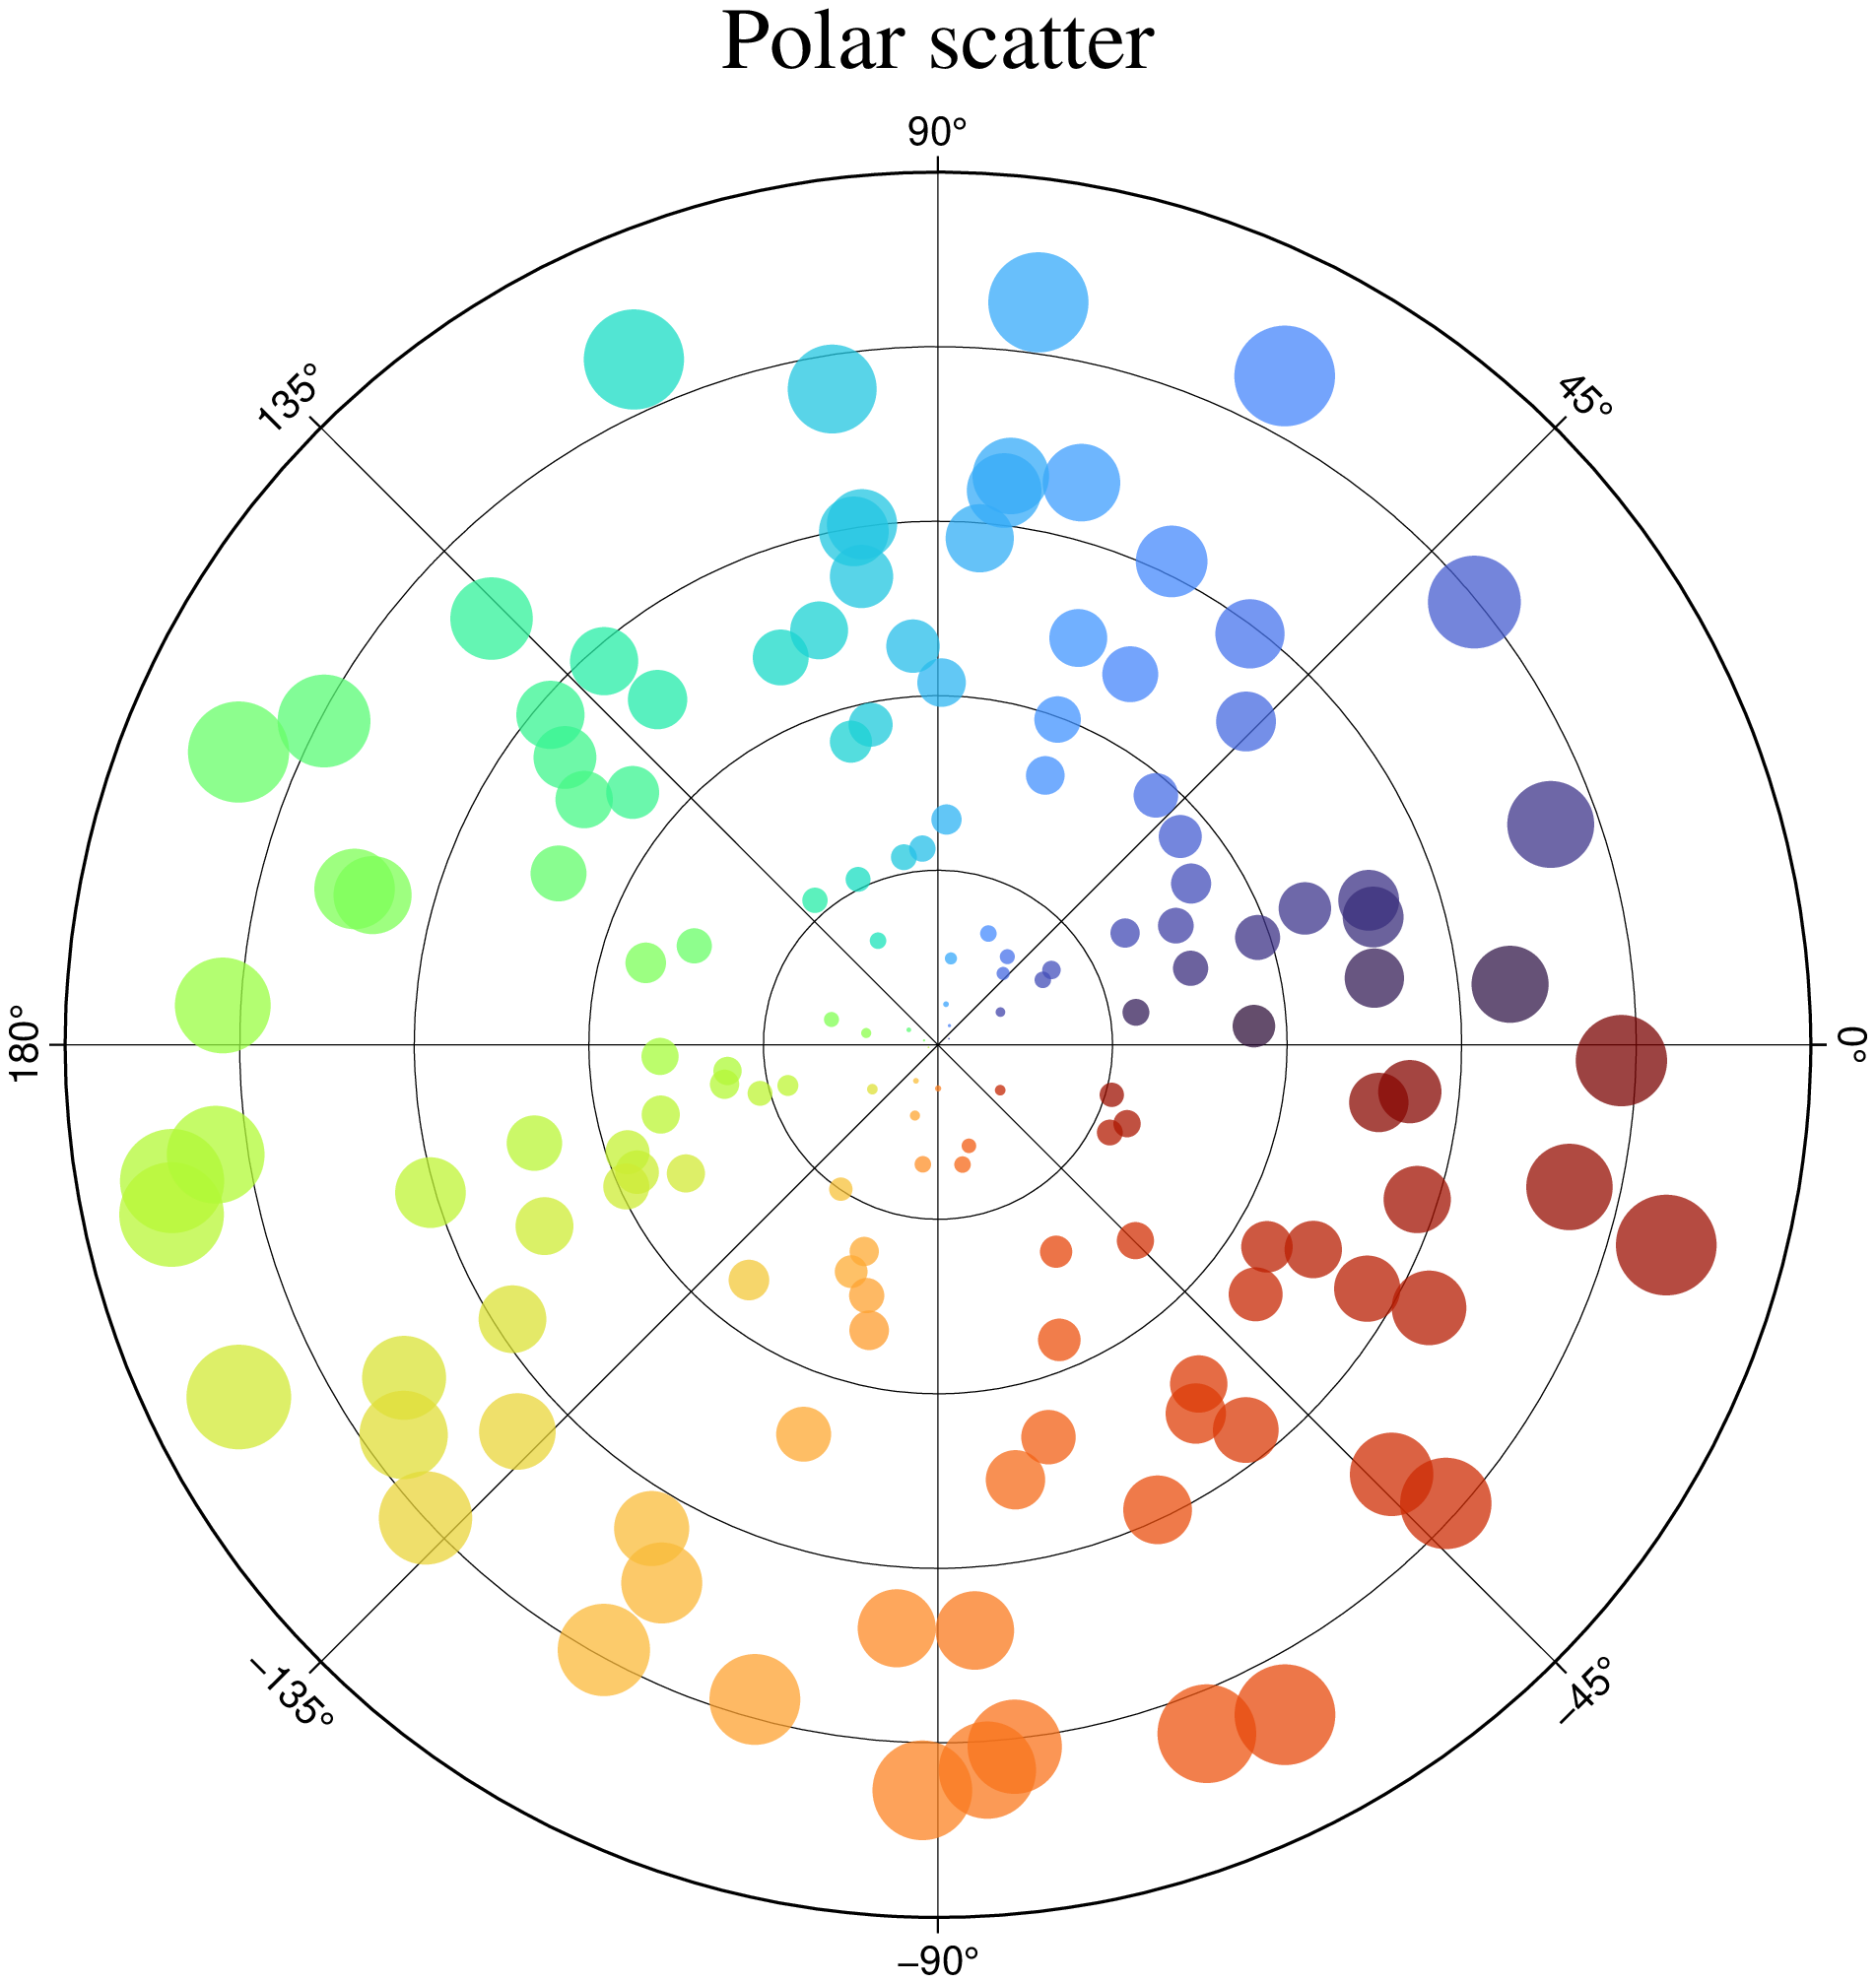
Draw a Polar scatter plot with variable symbol size, color and transparency. We will use the default color scale (turbo) and fig size (12 cm).
using GMT
teta = 2pi*rand(150)*180/pi; r = 9*rand(150); ms = r / 10;

scatter(teta, r,                  # The data
	limits=(0,360,0,10),      # Fig limits
        xaxis=(annot=45,grid=45), # Annotate and plor grid lines every 45 deg
        yaxis=(annot=2,grid=2),   # Same but for 2 units in radial direction
        proj=:Polar,              # Set the polar projection
        zcolor=teta,              # Assign color to each symbol
        size=ms,                  # The symbl sizes
        alpha=25,                 # Set transparency to 50%
        title="Polar scatter",    # Fig title
        show=true)                # Display the figure
Group scatters
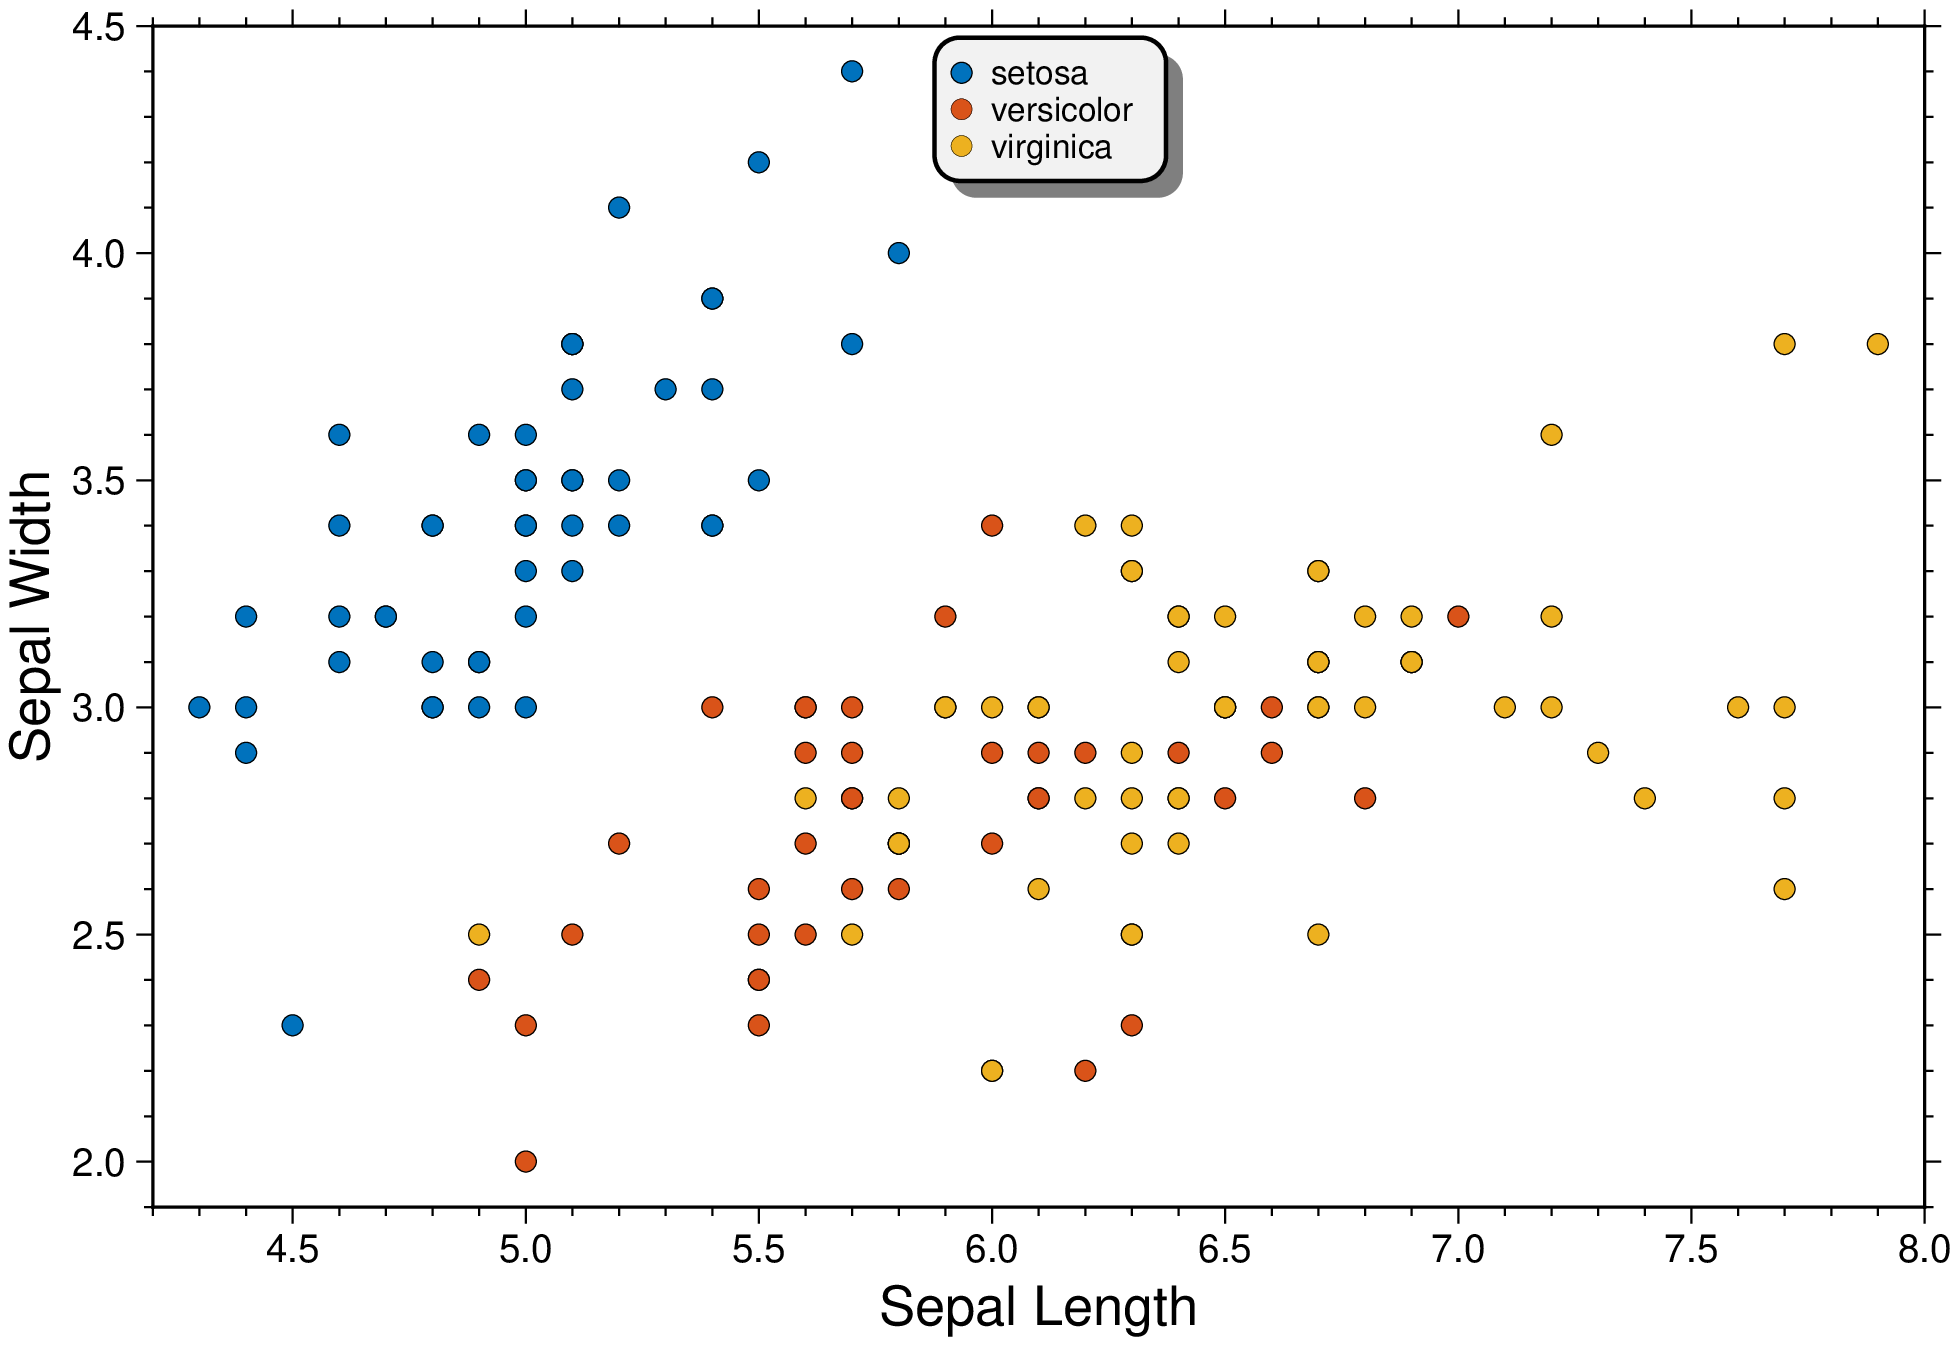
Split the different species in the iris dataset in its own colored groups. Use the first two columns in dataset and label the axes with their column names.
using GMT
scatter(getpath4docs("iris.dat"), xvar=1, yvar=2, hue="Species", xlabel=:auto, ylabel=:auto,
        legend=(pos=:TC, box=(pen=1, fill="gray95", shade=true, rounded=true)), show=true)
© GMT.jl. Last modified: June 07, 2023. Website built with Franklin.jl and the Julia programming language.
These docs were autogenerated using GMT: v1.33.1