Error bars
Examples
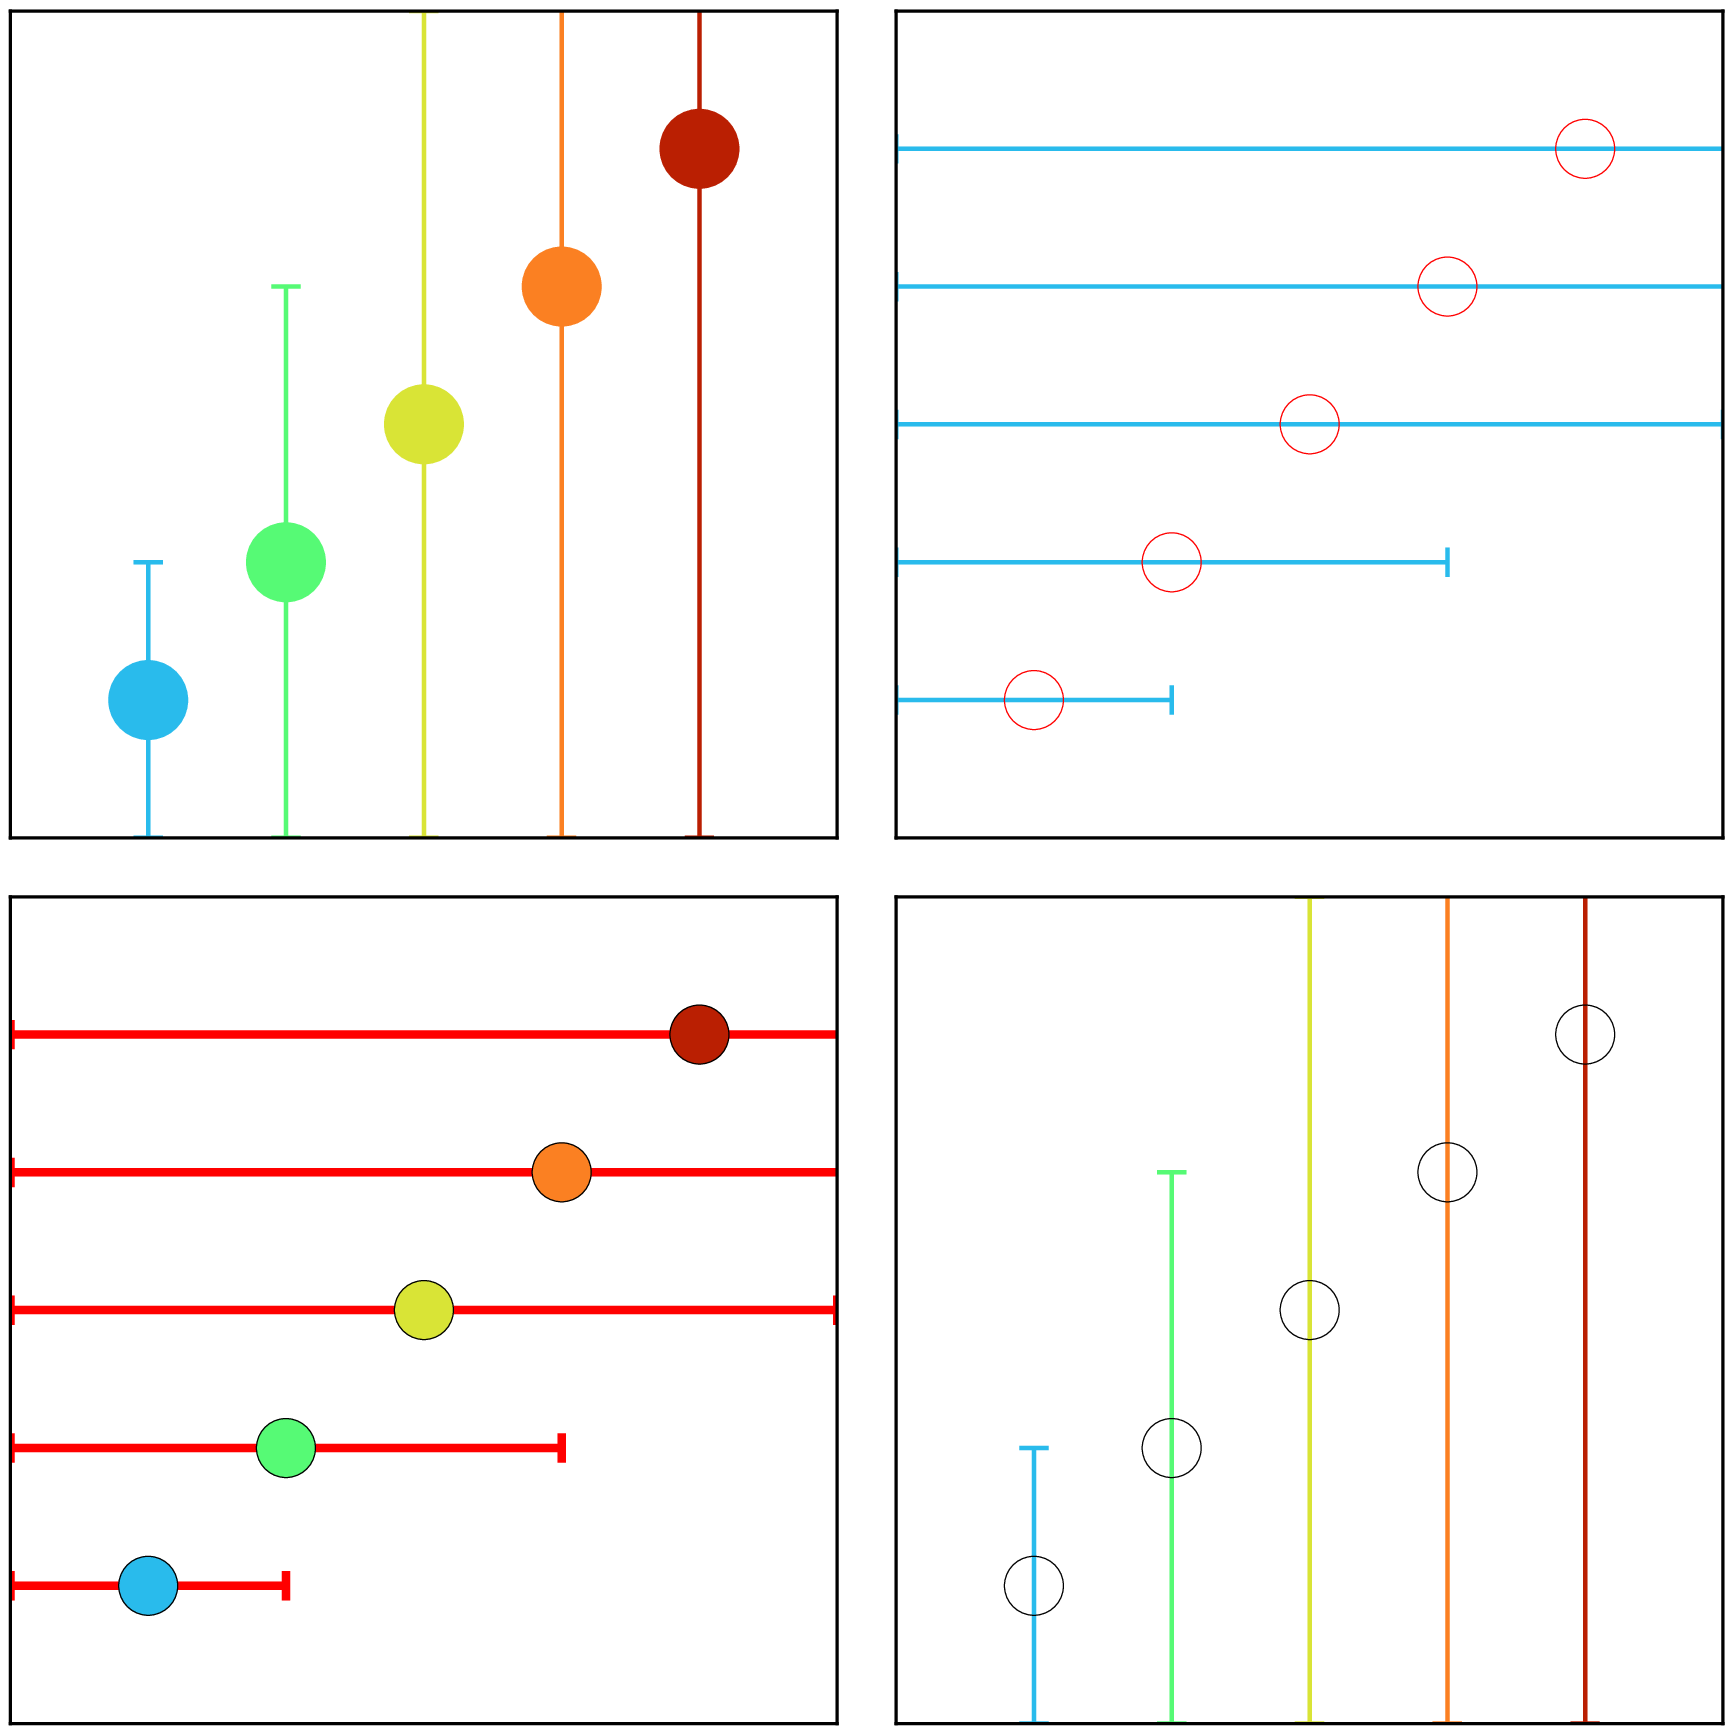
Plot error bars with different color control
using GMT

C = makecpt(range=(0,6,1));
t = [1 1 1 1
    2 2 2 1
    3 3 3 1
    4 4 4 1
    5 5 5 1];
plot(t, limits=(0,6,0,6), figsize=7, frame=:noannot, marker=:circle, ms=0.5,
     color=C, ml=0.25, error_bars=(x=:x, pen=(2,:red)), yshift=5)
plot!(t, frame=:noannot, marker=:circle, ms=0.5, color=C, ml=0.25,
      error_bars=(y=:y, pen=1, cline=true), xshift=7.5)
# Use the color map to paint the symbol marker line
plot!(t, frame=:noannot, marker=:circle, ms=0.5, color=C,
      ml=(lw=5, colored=true), error_bars=(y=:y, pen=1, csymbol=true),
      xshift=-7.5, yshift=7.5)
# Pretend our data array has only the coordinates and pass color col & errors via args
tt = t[:,1:2]
plot!(tt, frame=:noannot, marker=:circle, ms=0.5, color=C, mz=[1 2 3 4 5],
      ml=(0.25,:red), error_bars=(x=ones(5,1), pen=1, cline=true),
      xshift=7.5, show=true)
© GMT.jl. Last modified: June 07, 2023. Website built with Franklin.jl and the Julia programming language.
These docs were autogenerated using GMT: v1.33.1