Symbols & Linestyes
Examples
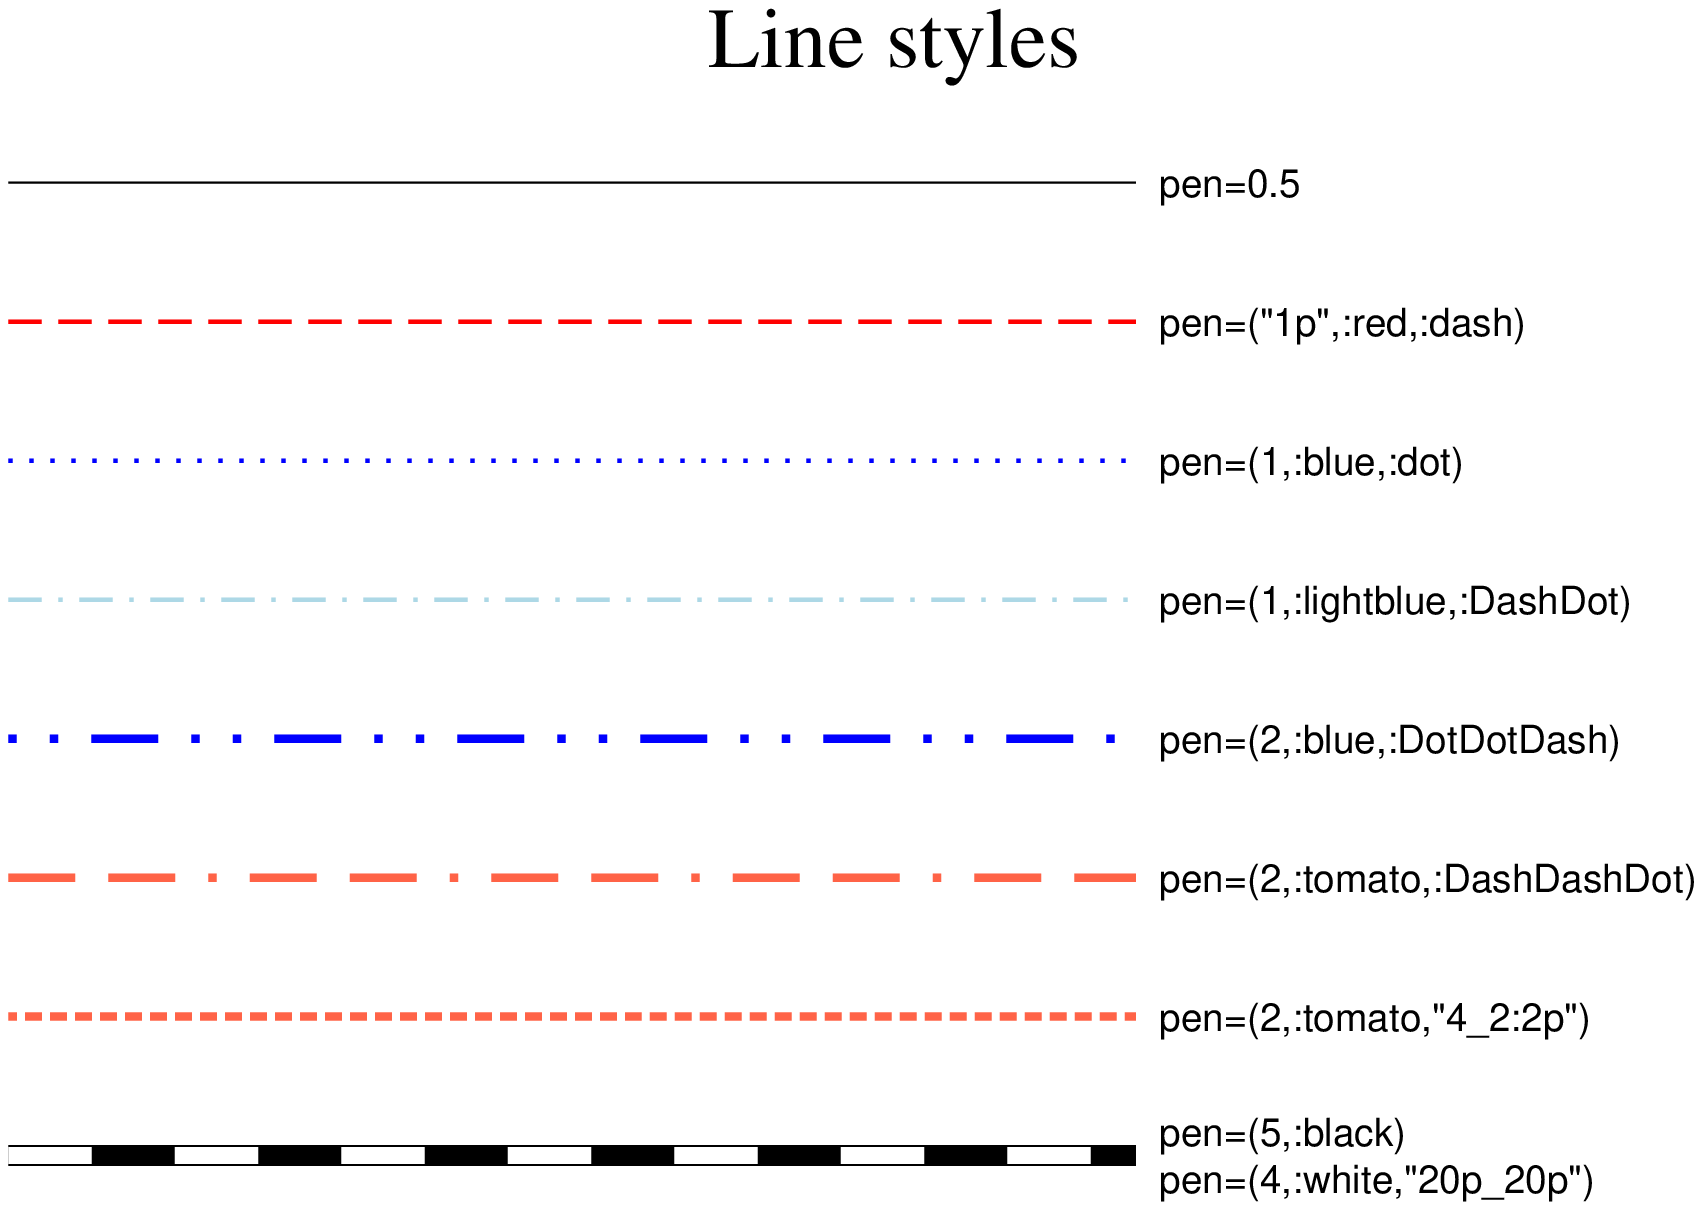
Line styles
using GMT

ls = ["pen=0.5",                      # default (a 0.5 points continuous black line)
      "pen=(\"1p\",:red,:dash)",      # dashed line
      "pen=(1,:blue,:dot)",           # dotted line
      "pen=(1,:lightblue,:DashDot)",  # dash-dotted line
      "pen=(2,:blue,:DotDotDash)",    # dot-dot-dashed line
      "pen=(2,:tomato,:DashDashDot)", # dash-dash-dotted line
      "pen=(2,:tomato,\"4_2:2p\")",   # A pattern of 4-point-long line segments and 2-point-long gaps between
                                      # segments, with pattern offset by 2 points from the origin
      "pen=(5,:black)",               # First line of the railway
      "pen=(4,:white,\"20p_20p\")"];  # Second line of the railway. Together they make the desired effect

# Helper variable with the above verbose pen settings converted to GMT hard-core syntax
_ls = ["0.5", "1p,red,-", "1p,blue,.", "1p,lightblue,-.", "2p,blue,..-",
      "2p,tomato,--.", "2p,tomato,4_2:2p", "5,black", "4p,white,20p_20p"];

# line coordinates
x = [0 7];  y = [9 8 7 6 5 4 3 2 2; 9 8 7 6 5 4 3 2 2];
D = mat2ds(y, x=x, pen=_ls, multi=true);    # GMTdataset with all info about the lines

# Plot the lines
plot(D, region=(0,11,1,9.5), title="Line styles", frame=:none)

# Plot all texts but the one referring to last line that must be broken in two tokens
for k = 1:length(ls)-2
    text!(x=x[end], y=y[1,k], text=ls[k], justify=:ML, offset=(0.2,0))
end
text!(x=x[end], y=y[1,end], text=ls[end-1], justify=:ML, offset=(0.2,0.2))
text!(x=x[end], y=y[1,end], text=ls[end],   justify=:ML, offset=(0.2,-0.2), show=true)
Line styles
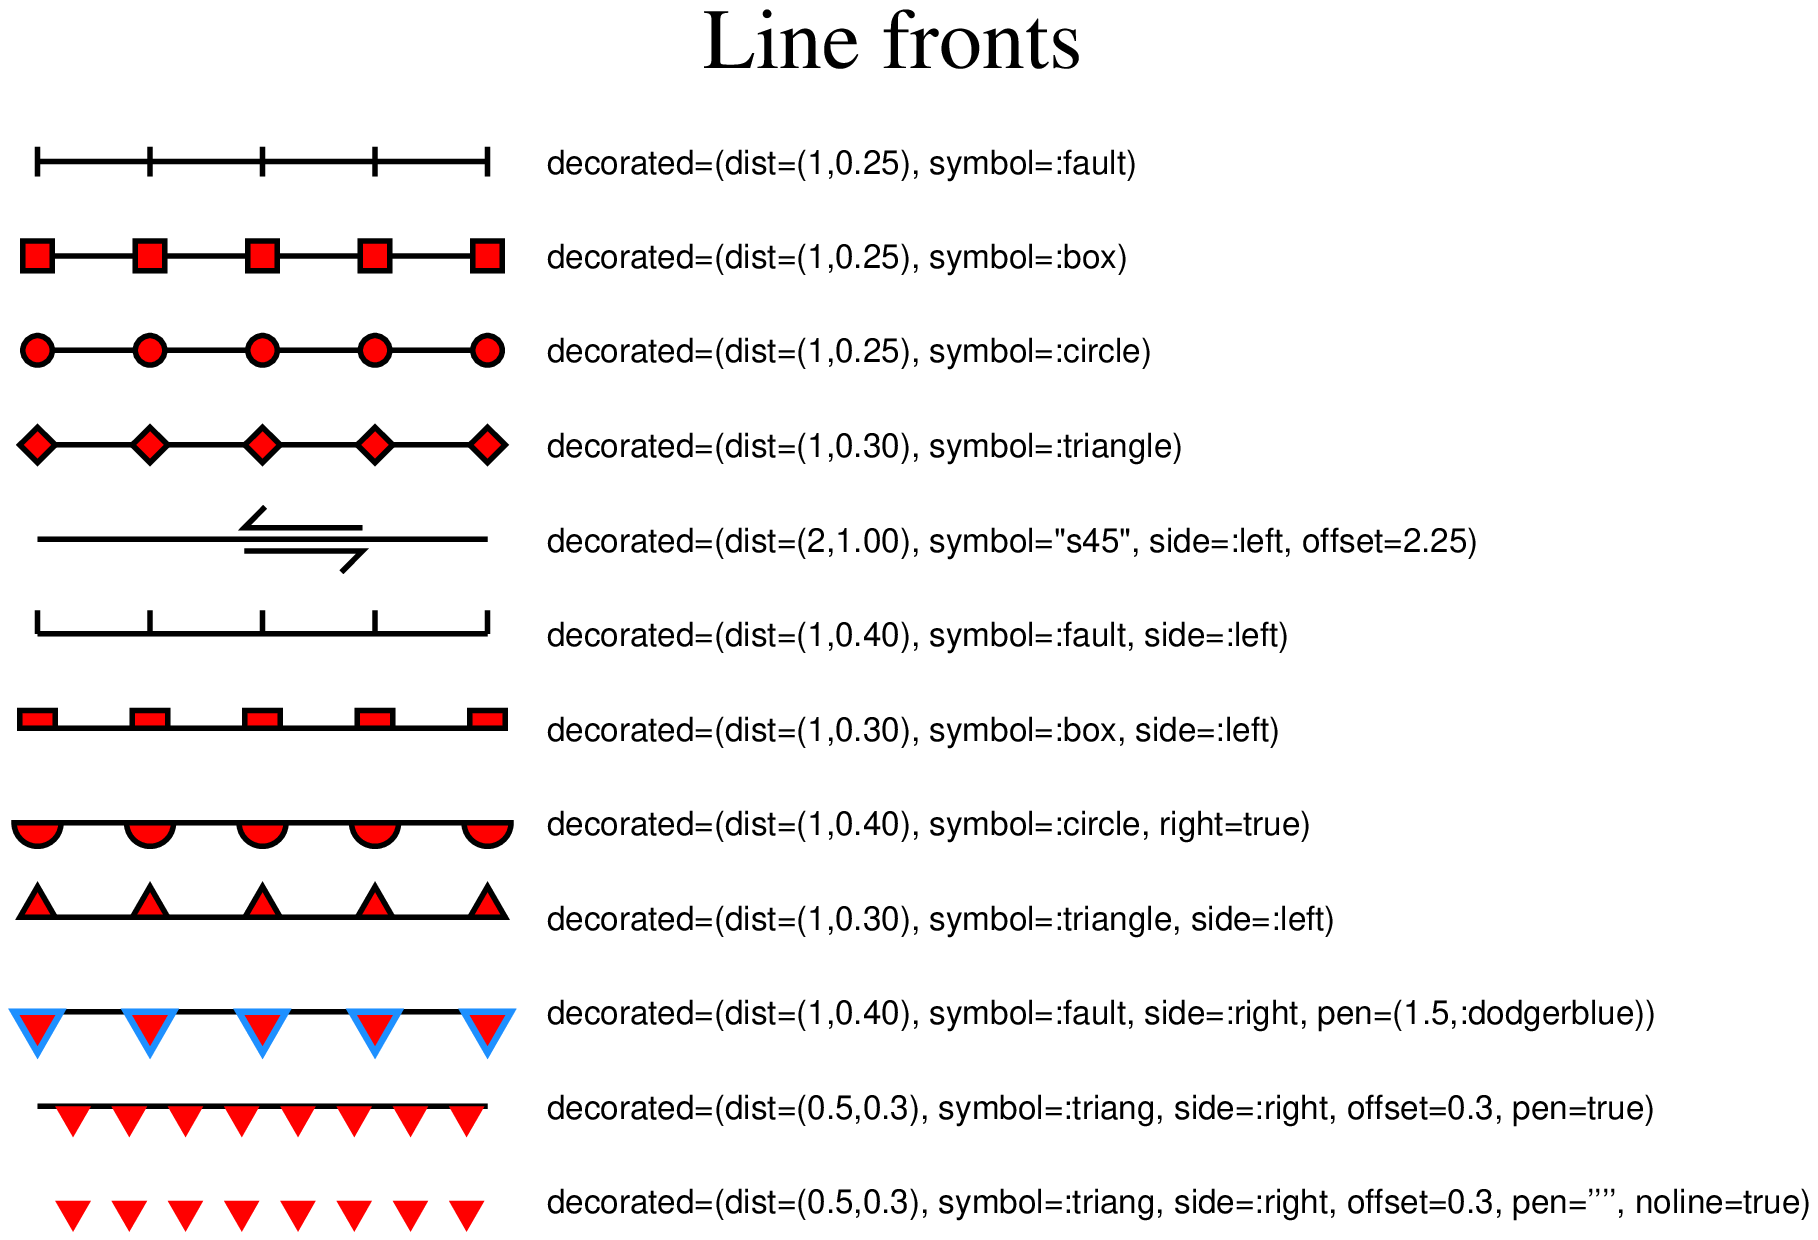
Draw a so-called front which allows to plot specific symbols distributed along a line or curve. Typical use cases are weather fronts, fault lines, subduction zones, and more.
using GMT

# keyword/value way of controlling the Front line styles.
fs = ["decorated=(dist=(1,0.25), symbol=:fault)",
      "decorated=(dist=(1,0.25), symbol=:box)",
      "decorated=(dist=(1,0.25), symbol=:circle)",
      "decorated=(dist=(1,0.30), symbol=:triangle)",
      "decorated=(dist=(2,1.00), symbol=\"s45\", side=:left, offset=2.25)",
      "decorated=(dist=(1,0.40), symbol=:fault, side=:left)",
      "decorated=(dist=(1,0.30), symbol=:box, side=:left)",
      "decorated=(dist=(1,0.40), symbol=:circle, right=true)",
      "decorated=(dist=(1,0.30), symbol=:triangle, side=:left)",
      "decorated=(dist=(1,0.40), symbol=:fault, side=:right, pen=(1.5,:dodgerblue))",
      "decorated=(dist=(0.5,0.3), symbol=:triang, side=:right, offset=0.3, pen=true)",
      "decorated=(dist=(0.5,0.3), symbol=:triang, side=:right, offset=0.3, pen='''', noline=true)"];

# Helper variable with the above verbose pen settings converted to GMT hard-core syntax
_fs = ["1c/0.25c", "1c/0.25c+b", "1c/0.25c+c", "1c/0.3c+t", "2c/1c+l+s45+o2.25c", "1c/0.4c+l",
       "1c/0.3c+l+b", "1c/0.4c+r+c", "1c/0.3c+l+t", "1c/0.4c+r+t+p1.5p,dodgerblue",
       "0.5c/0.3c+r+t+o0.3c+p", "0.5c/0.3c+r+t+o0.3c+p+i"];

# line coordinates
x = [1 6];  y = [20 19 18 17 16 15 14 13 12 11 10 9; 20 19 18 17 16 15 14 13 12 11 10 9];
D = mat2ds(y, x=x, lt=1.25, front=_fs, fill=["red"], multi=true);    # GMTdataset with all info about the lines

# Plot the lines
plot(D, region=(0,21,8,20.5), figsize=(16,10), title="Line fronts", symbol=:f, frame=:none)

# Plot the texts with the verbose front style settings
for k = 1:length(fs)
    text!(x=x[end], y=y[1,k], text=fs[k], font=8, justify=:ML, offset=(0.5,0))
end
showfig()
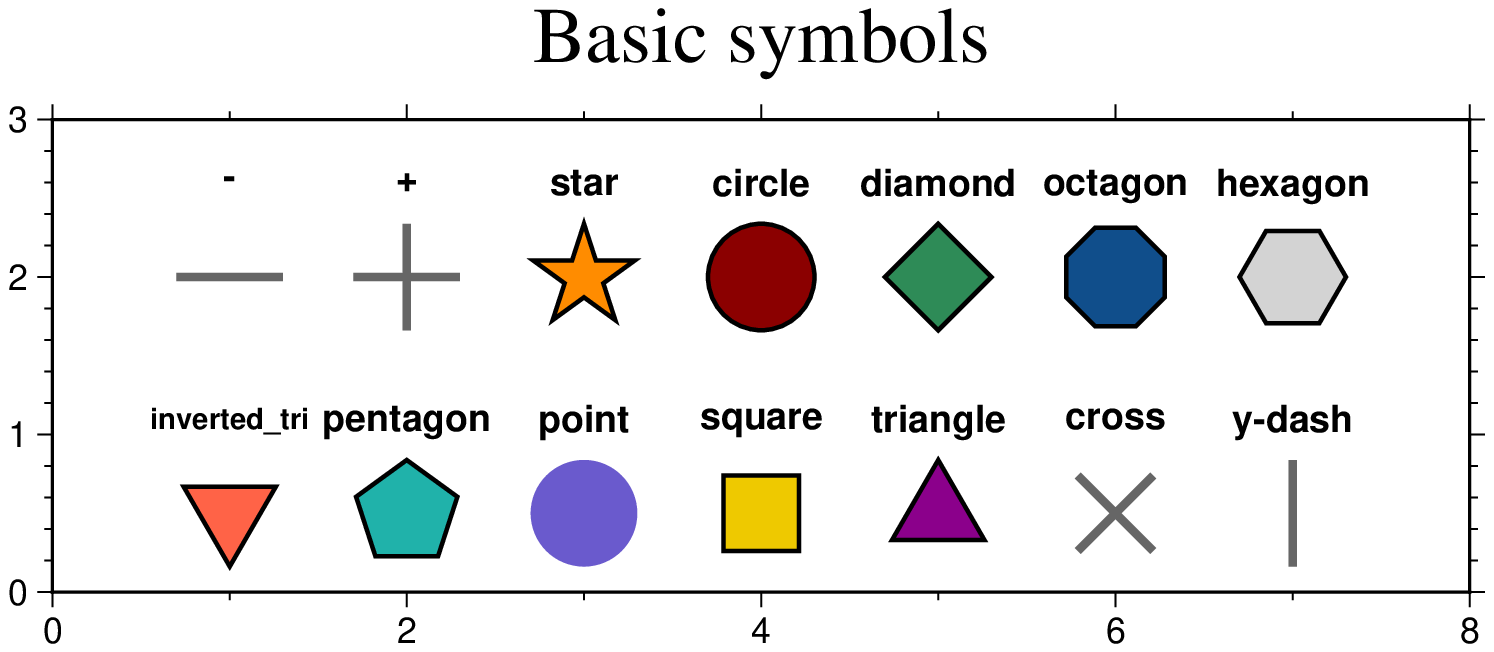
Basic geometric symbols
using GMT

font = "9p,Helvetica-Bold"

plot(region=[0, 8, 0, 3], figsize=(12,4), x=1, y=2, marker="-", ms=0.9,
     ml=(2,:gray40), title="Basic symbols", text=(txt="-", x=1, y=2.6, font=font))

plot!(x=2, y=2, marker="+", ms=0.9, ml=(2,:gray40),
      text=(txt="+", x=2, y=2.6, font=font))

plot!(x=3, y=2, marker=:star, ms=0.9, mc=:darkorange,
      ml=1, text=(txt="star", x=3, y=2.6, font=font))

plot!(x=4, y=2, marker=:circ, ms=0.9, mc=:darkred,
      ml=1, text=(txt="circle", x=4, y=2.6, font=font))

plot!(x=5, y=2, marker=:diamond, ms=0.9, mc=:seagreen,
      ml=1, text=(txt="diamond", x=5, y=2.6, font=font))

plot!(x=6, y=2, marker=:octagon, ms=0.9, mc=:dodgerblue4,
      ml=1, text=(txt="octagon", x=6, y=2.6, font=font))

plot!(x=7, y=2, marker=:hexagon, ms=0.9, mc=:lightgray,
      ml=1, text=(txt="hexagon", x=7, y=2.6, font=font))

plot!(x=1, y=0.5, marker=:inverted_tri, ms=0.9, mc=:tomato,
      ml=1, text=(txt="inverted_tri", x=1, y=1.1, font="7p,Helvetica-Bold"))

plot!(x=2, y=0.5, marker=:pentagon, ms=0.9, mc=:lightseagreen,
      ml=1, text=(txt="pentagon", x=2, y=1.1, font=font))

plot!(x=3, y=0.5, marker=:point, ms=0.9, mc=:slateblue,
      ml=1, text=(txt="point", x=3, y=1.1, font=font))

plot!(x=4, y=0.5, marker=:square, ms=0.9, mc=:gold2,
      ml=1, text=(txt="square", x=4, y=1.1, font=font))

plot!(x=5, y=0.5, marker=:triangle, ms=0.9, mc=:magenta4,
      ml=1, text=(txt="triangle", x=5, y=1.1, font=font))

plot!(x=6, y=0.5, marker=:cross, ms=0.9, ml=(2,:gray40),
      text=(txt="cross", x=6, y=1.1, font=font))

plot!(x=7, y=0.5, marker="y-dash", ms=0.9, ml=(2,:gray40),
      text=(txt="y-dash", x=7, y=1.1, font=font))

showfig()
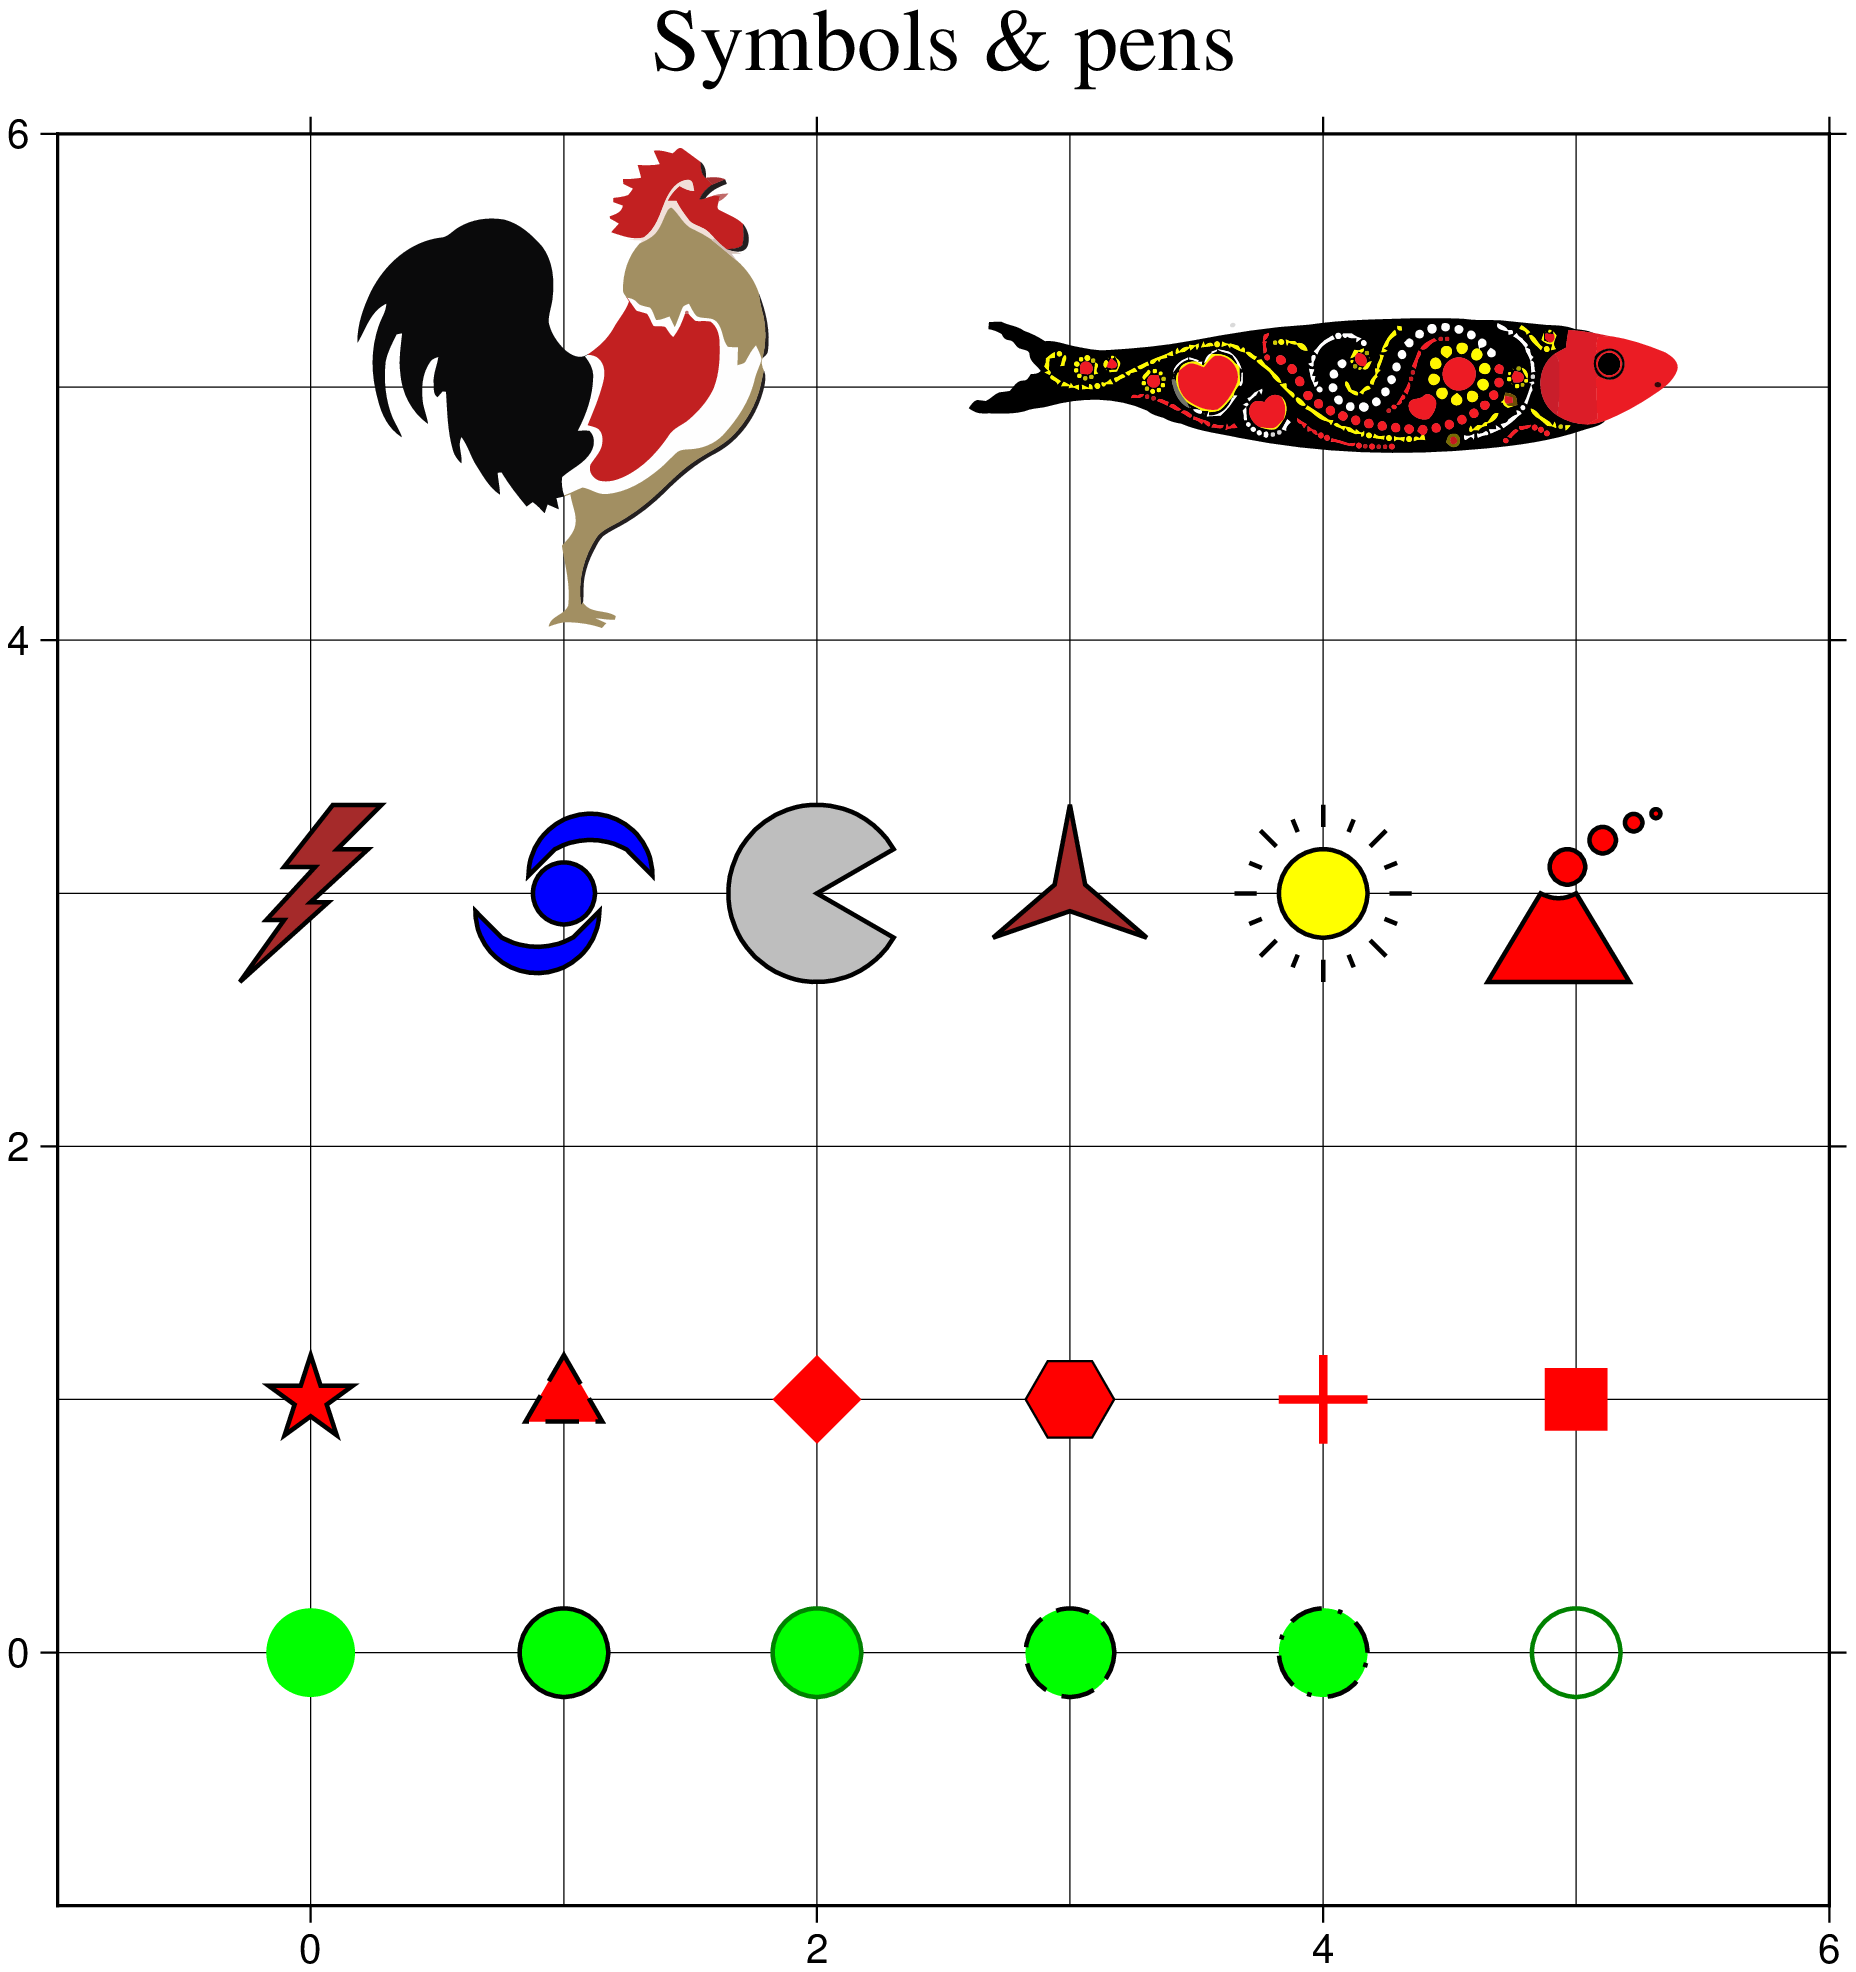
Basic and custom symbols
using GMT

plot([0 0], limits=(-1,6,-1,6), figsize=(15,15), marker=:circle, ms=0.75,
     fill=:green, frame=(axes=:WSen, annot=2,grid=1, title="Symbols & pens"))
plot!([1 0], marker=:circle, ms=0.75, fill=:green, ml=(1,:black))
plot!([2 0], marker=:circle, ms=0.75, fill=:green, ml=(1,"0/130/0"))
plot!([3 0], marker=:circle, ms=0.75, fill=:green, ml=(1,:black, :dashed))
plot!([4 0], marker=:circle, ms=0.75, fill=:green, ml=(1,:black, "-."))
plot!([5 0], marker=:circle, ms=0.75, fill="-",    ml=(1,"0/130/0"))
plot!([0 1], marker=:star,   ms=0.75, fill=:red,   ml=(1,:black))
plot!([1 1], marker=:triang, ms=0.75, fill=:red,   ml=(1,:black,:dashed))
plot!([2 1], marker=:diamond,ms=0.75, fill=:red)
plot!([3 1], marker=:hexagon,ms=0.75, fill=:red,   ml=(0.5,:black))
plot!([4 1], marker=:plus,   ms=0.75, ml=(2,:red))
plot!([5 1], marker=:square, ms=0.75, fill=:red)
plot!([0 3], marker=(custom="flash", size=1.5),  ml=1, fill=:brown)
plot!([1 3], marker=(custom="hurricane", size=1.5),  ml=1, fill=:blue)
plot!([2 3], marker=(custom="pacman",  size=1.5),  ml=1, fill=:gray)
plot!([3 3], marker=(custom="star3",   size=1.5),  ml=1, fill=:brown)
plot!([4 3], marker=(custom="sun",     size=1.5),  ml=1, fill=:yellow)
plot!([5 3], marker=(custom="volcano", size=1.5),  ml=1, fill=:red)
plot!([1 5], marker=(custom="@gallo",  size=3.5))
plot!([4 5], marker=(custom="@sardinha", size=6.0), show=true)
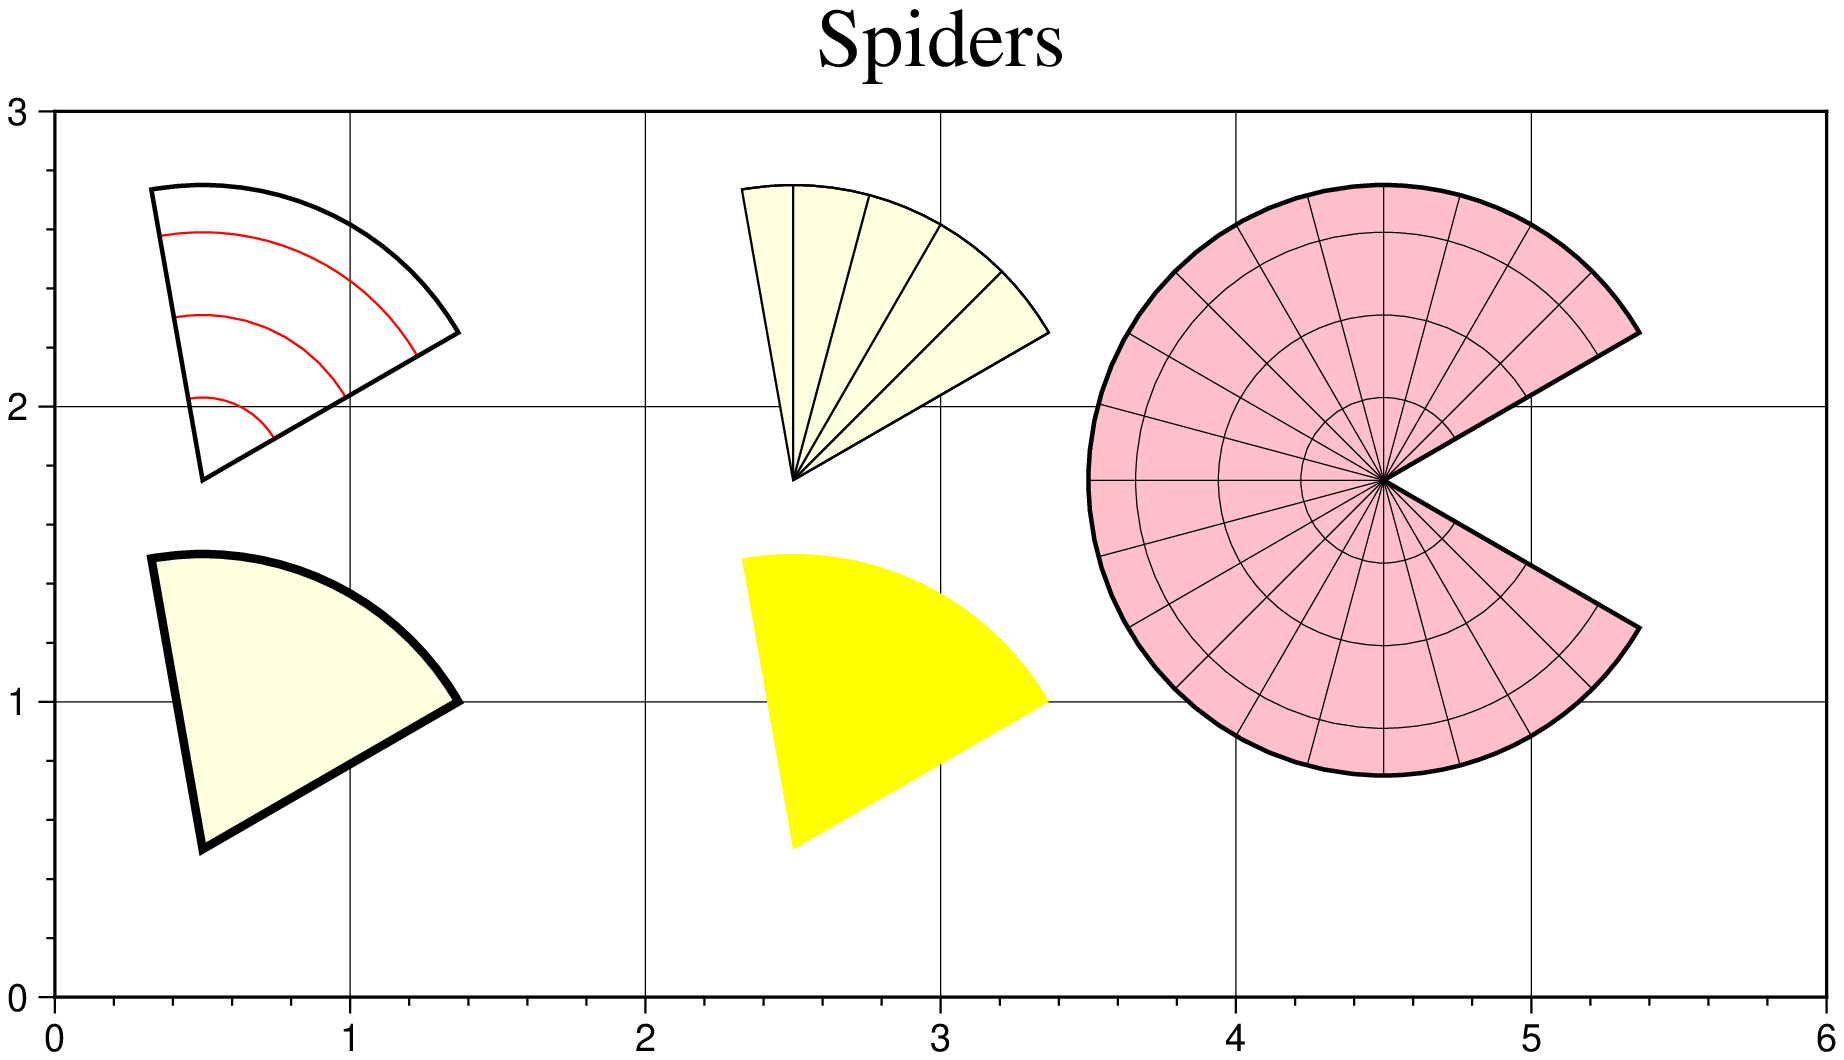
Spiders
Plot Pies, Wedges or Web (spiders). They are all synonims. We show here three different ways of plotting this symbol (depending of its complexity)
using GMT
plot([0.5 0.5 30 100], limits=(0,6,0,3), figscale=2.5, frame="afg",
     marker=:wedge, ms=5, fill=:lightyellow, ml=2, title="Spiders")
plot!([2.5 0.5 30 100], marker=:wedge, ms=5, fill=:yellow)
plot!([0.5 1.75 30 100], marker=(web=true, size=5, arc=0.7, pen=(0.5,:red)), ml=1)
plot!([2.5 1.75 30 100], marker=(web=true, size=5, radial=15),
      fill=:lightyellow, ml=0.5)
# But we can also send the Web angle info via marker and use a Tuple as argument.
plot!([4.5 1.75], marker=(:web, [30 330], (size=5, arc=0.7, radial=15, pen=0.25)),
      fill=:pink, ml=1, show=true)
© GMT.jl. Last modified: June 07, 2023. Website built with Franklin.jl and the Julia programming language.
These docs were autogenerated using GMT: v1.33.1