Histograms
Fequency histogram
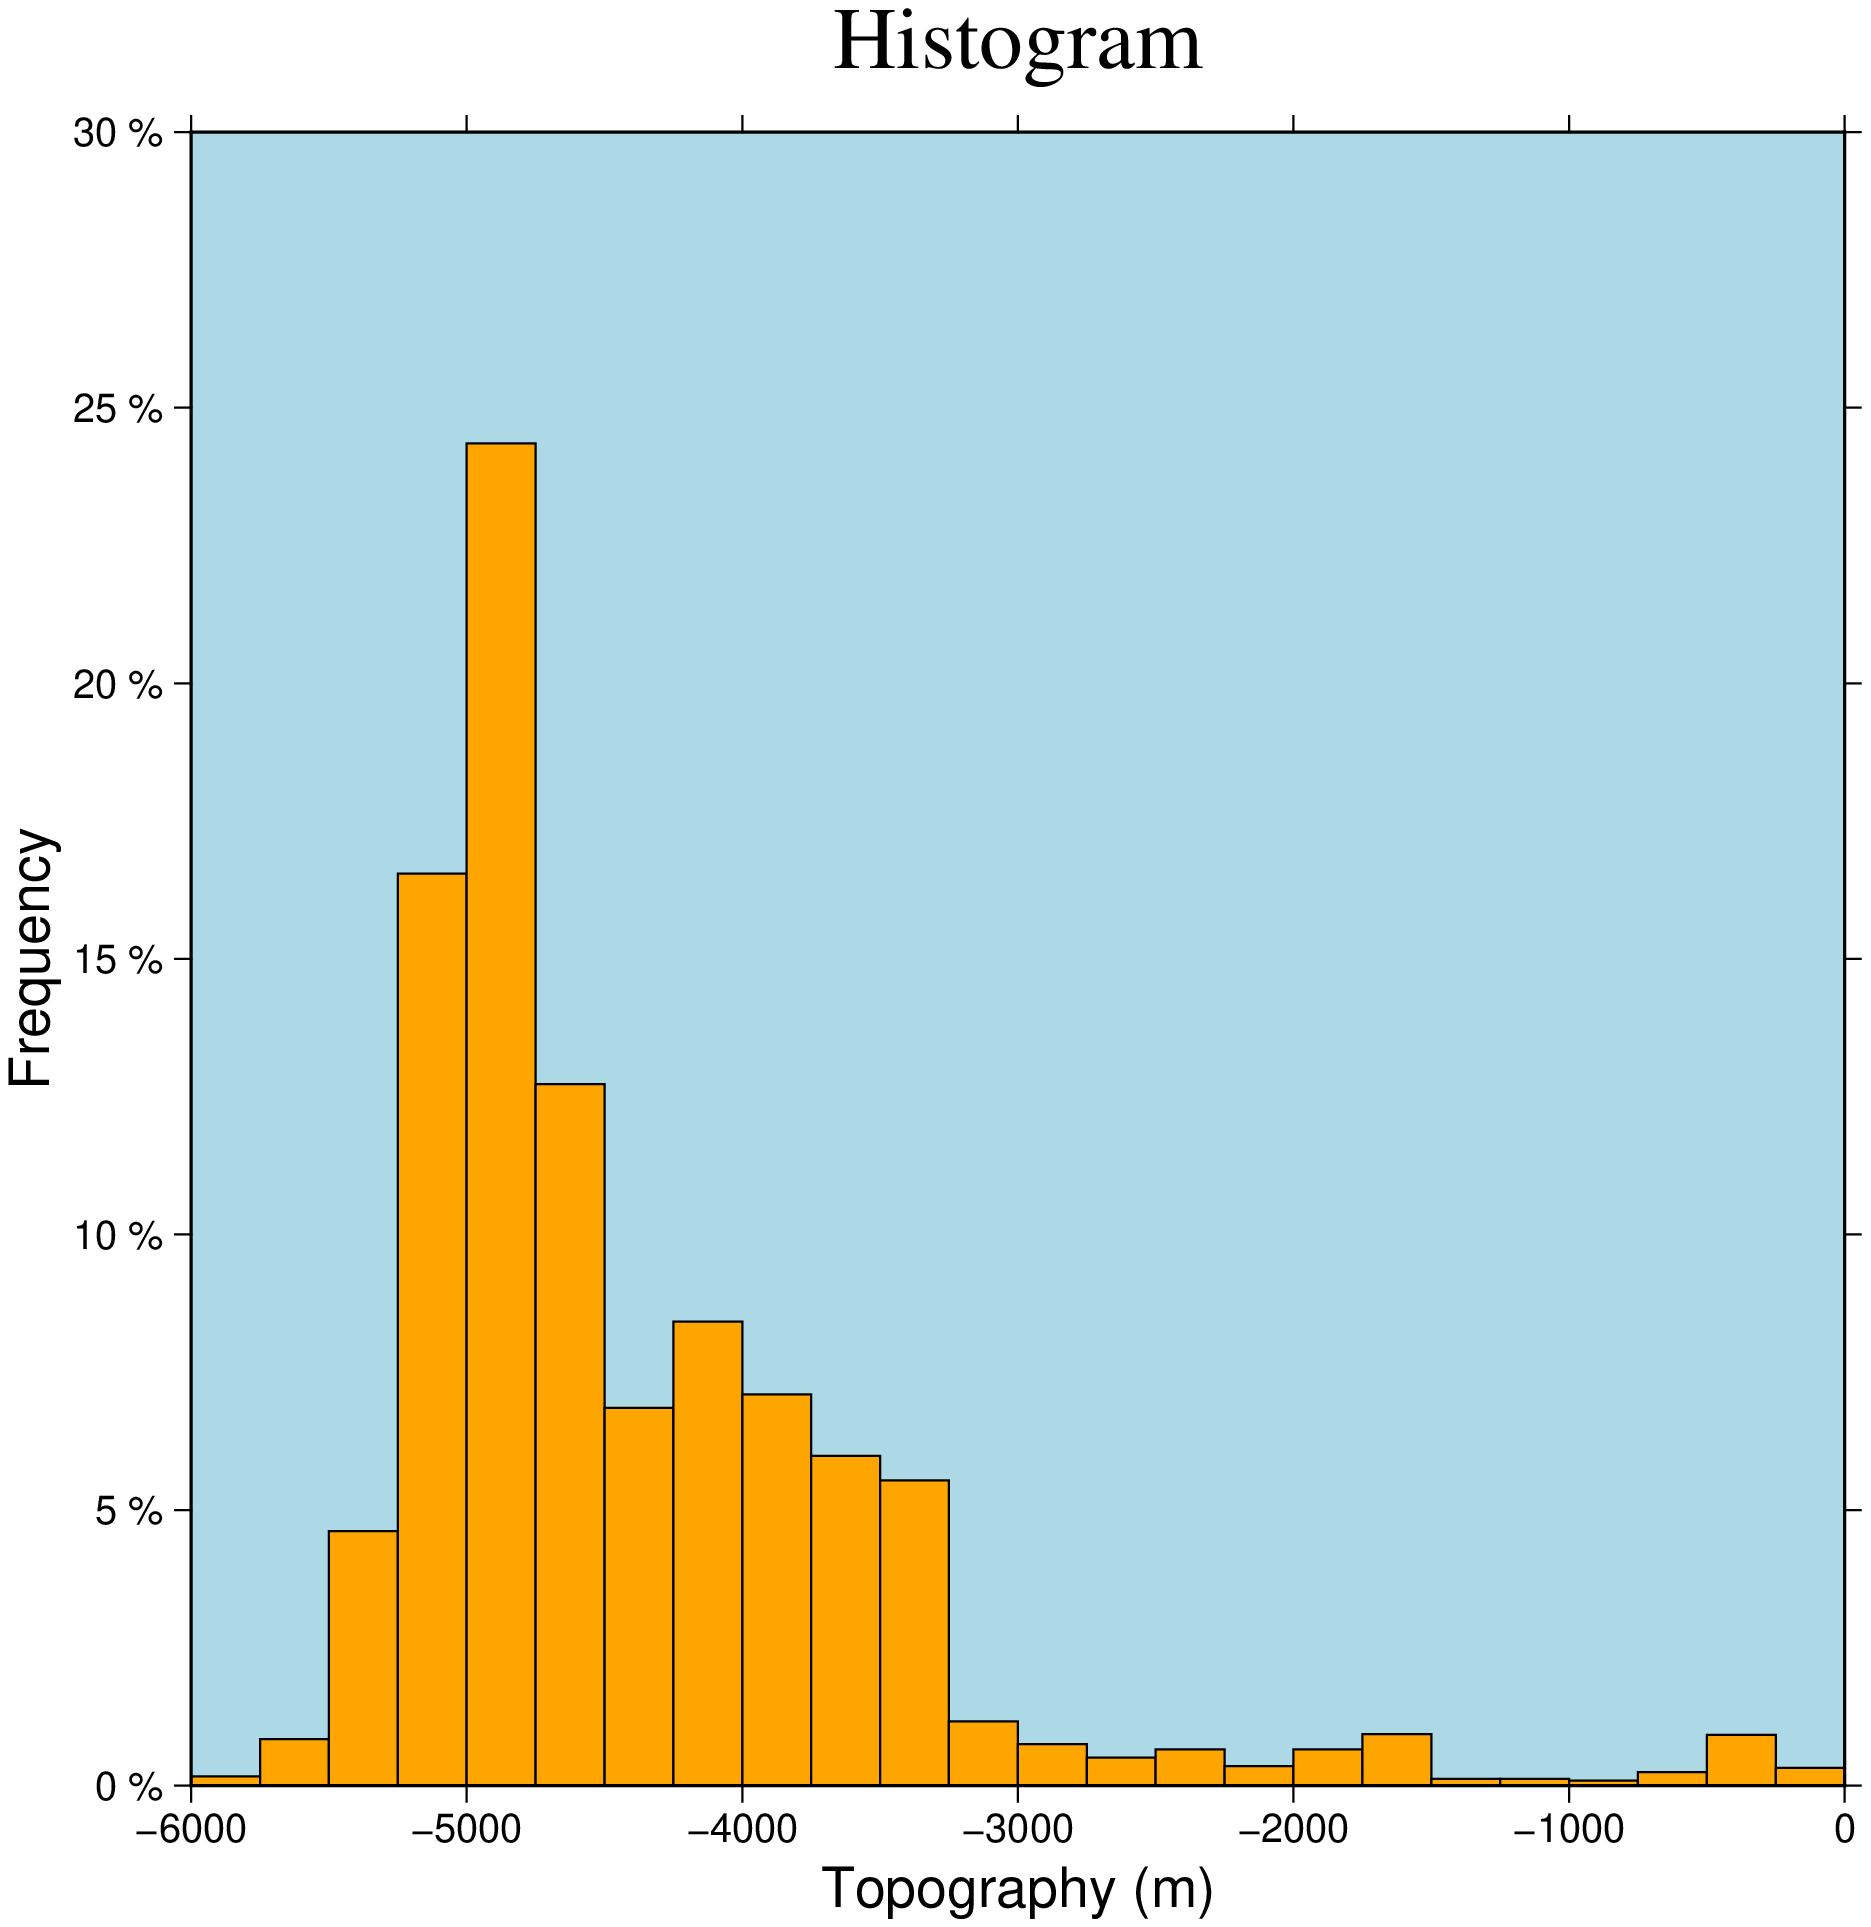
The remote file v3206_06.txt contains bathymetry measurements from Vema cruise 3206. Make a frequency histogram of those depths.
In this example we break the frame settings in several pieces, specally because we want to add a suffix to the yy annotations.
using GMT
histogram("@v3206_06.txt", region=(-6000,0,0,30),
          frame=(axes=:WSen, annot=:auto, title="Histogram", fill=:lightblue),
          xlabel="Topography (m)", yaxis=(label="Frequency", suffix=" %"),
          fill=:orange, pen=0.5, kind=:frequency, bin=250, show=true)
Polar histogram
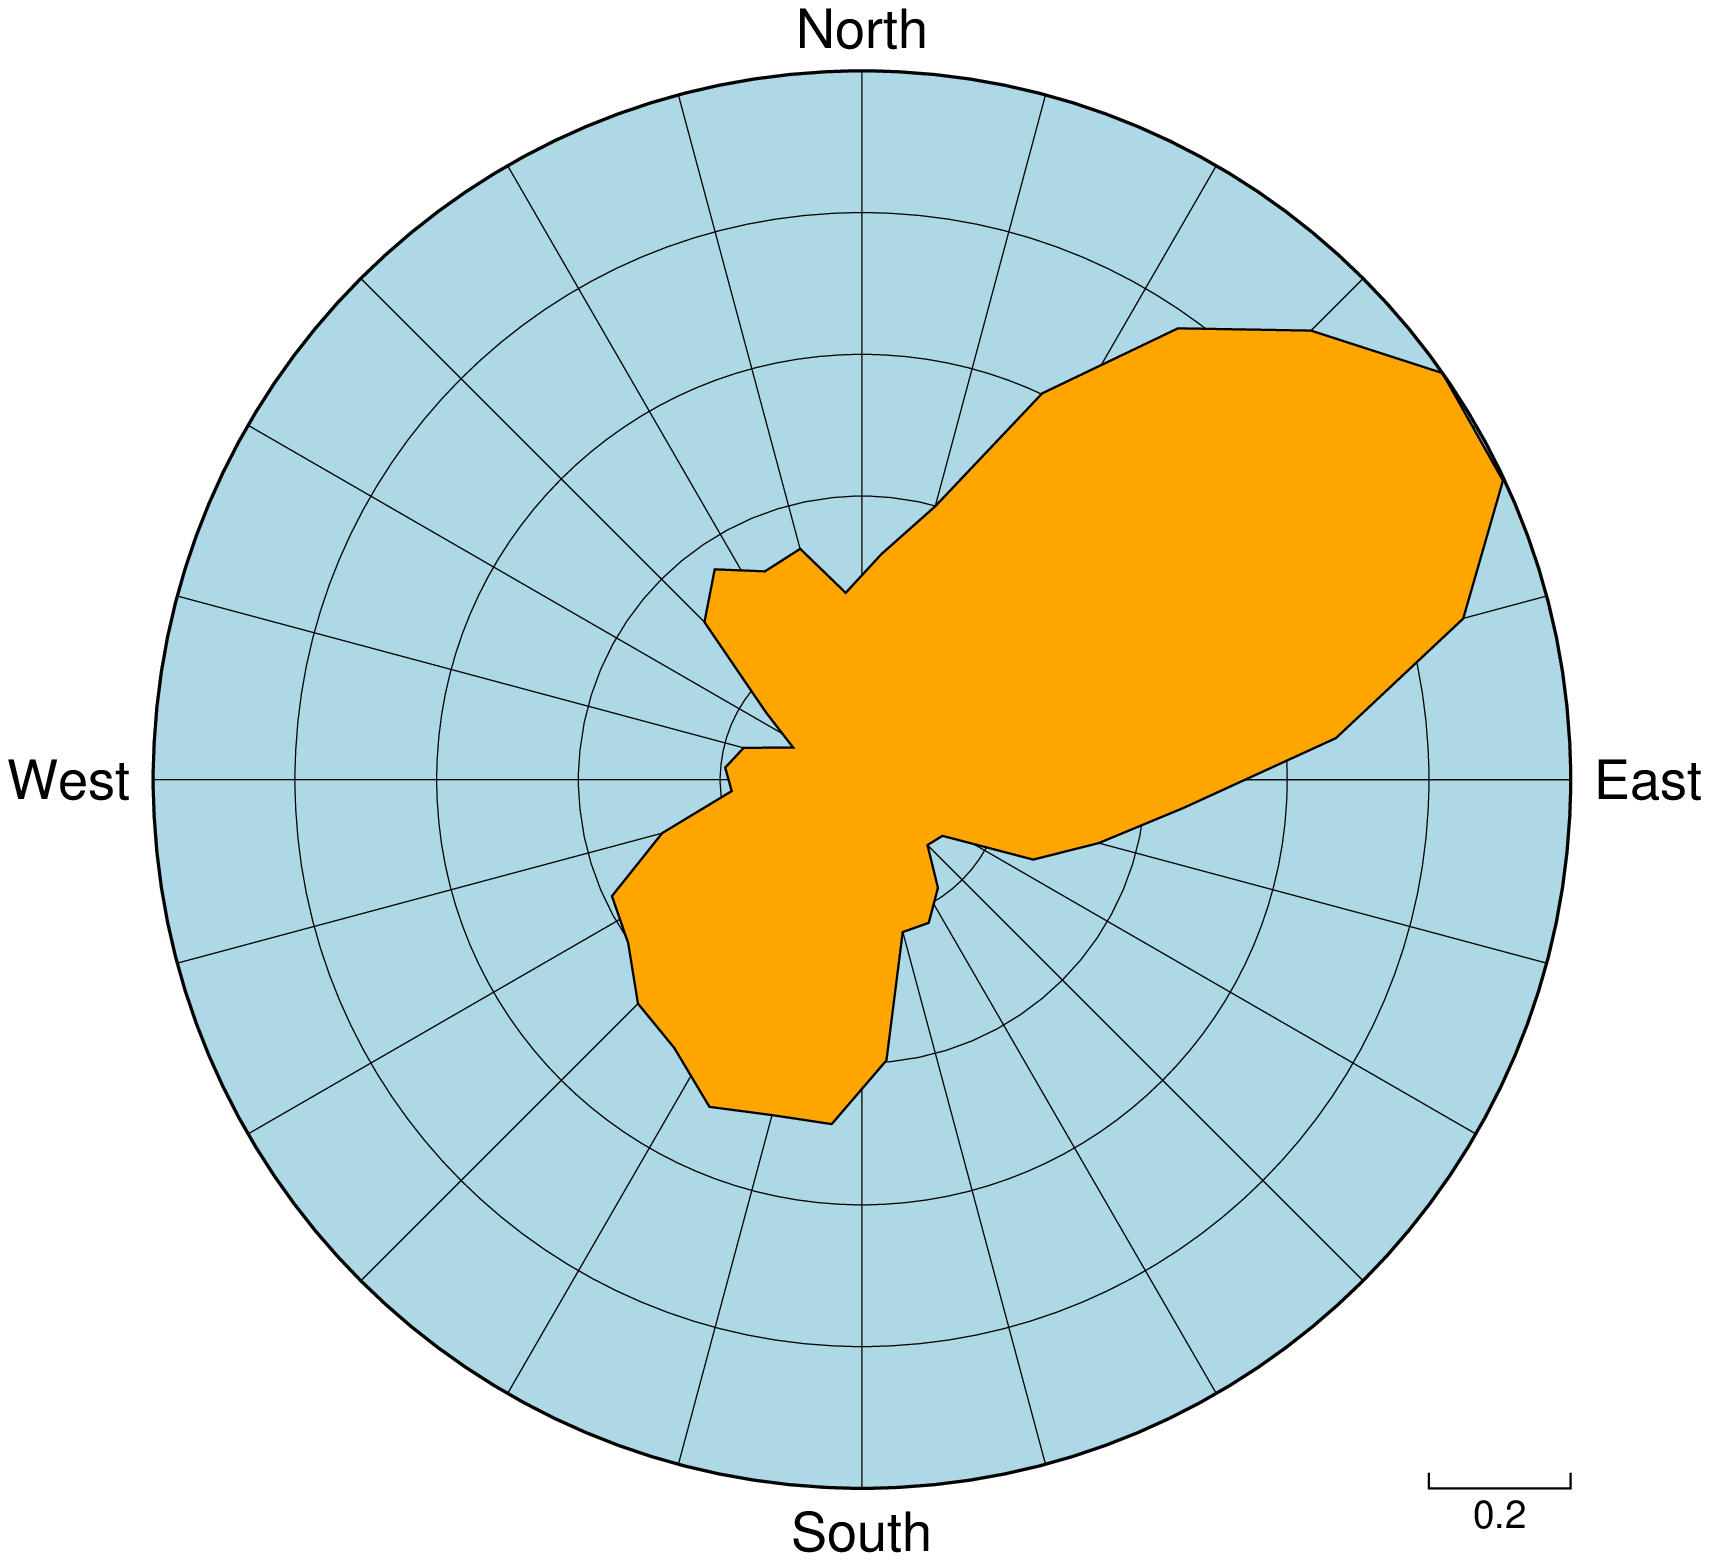
The remote file fractures_06.txt contains a compilation of fracture lengths and directions as digitized from geological maps. We will use it to create a rose diagram.
using GMT
rose("@fractures_06.txt", region=(0,1,0,360), frame=(grid=:auto, fill=:lightblue),
     yx=true, sector=(width=10, rose=true), normalize=true, fill=:orange, pen=0.5, show=true)
Stepped patch histogram
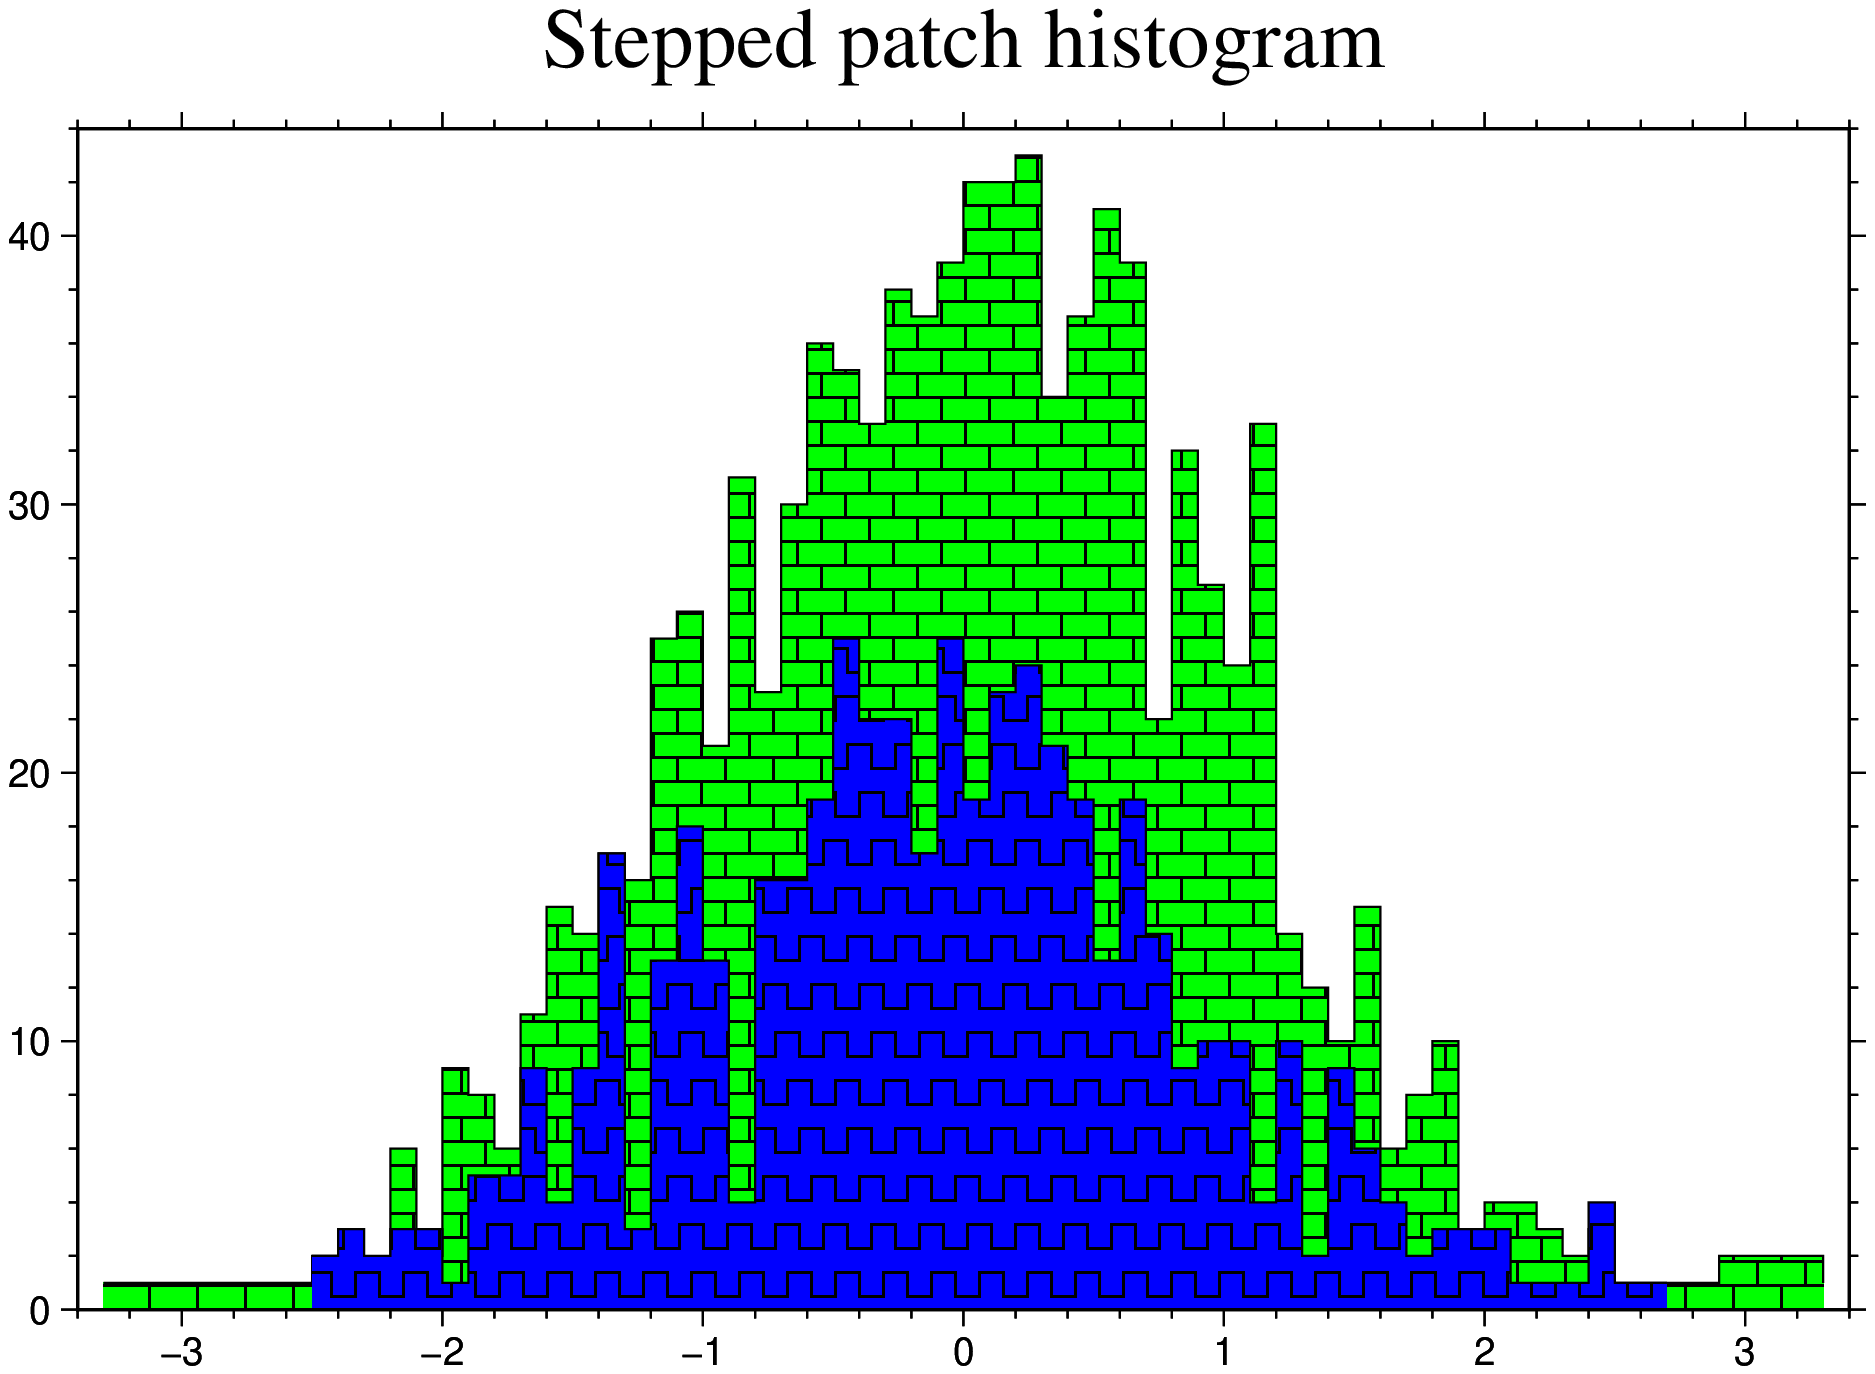
Draw a histogram as a stepped patch
using GMT
D1 = histogram(randn(1000), I=:o, bin=0.1);  # Create histogrammed data with bin = 0.1 (I=:o to create the dataset)
D2 = histogram(randn(500),  I=:o, bin=0.1);

lines(D1,                    # The data
      steps=(x=true,),       # Make steps a xx
      close=(bot="",),       # Close polygon at the bottom
      fill=(pattern=20, bg=:green, dpi=200),    # Set the pattern code, the background color and dpi
      figsize=(15,10))       # Set fig size of 15x10 cm
lines!(D2,                   # Second dataset
      steps=(x=true,),
      close=(bot="",),
      fill=(pattern=82,bg=:blue,dpi=100),
      title="Stepped patch histogram", show=true)
© GMT.jl. Last modified: June 07, 2023. Website built with Franklin.jl and the Julia programming language.
These docs were autogenerated using GMT: v1.11.0