Color images
Color images are made with grdimage which takes the usual common options and a color map. It operates over grids or images. The next example shows how to create a color appropriate for the grid's z range, plot the image and add a color scale. We use here the data keyword to tell the program to load the grid from a file. The @ before the tut_relief.nc file name instructs GMT to download the file from its server on the first usage and save it in a cache dir. See the GMT tuturial for more details about what the arguments mean.
using GMT

topo = makecpt(color=:rainbow, range=(1000,5000,500), continuous=true);
grdimage("@tut_relief.nc", shade=(azimuth=100, norm="e0.8"), proj=:Mercator, frame=:a, color=topo)
colorbar!(pos=(outside=:TC,length=(12.5,0.6), horizontal=true, offset=(0,1.0)), region="@tut_relief.nc",
          color=topo, frame=(ylabel=:m,), show=true)

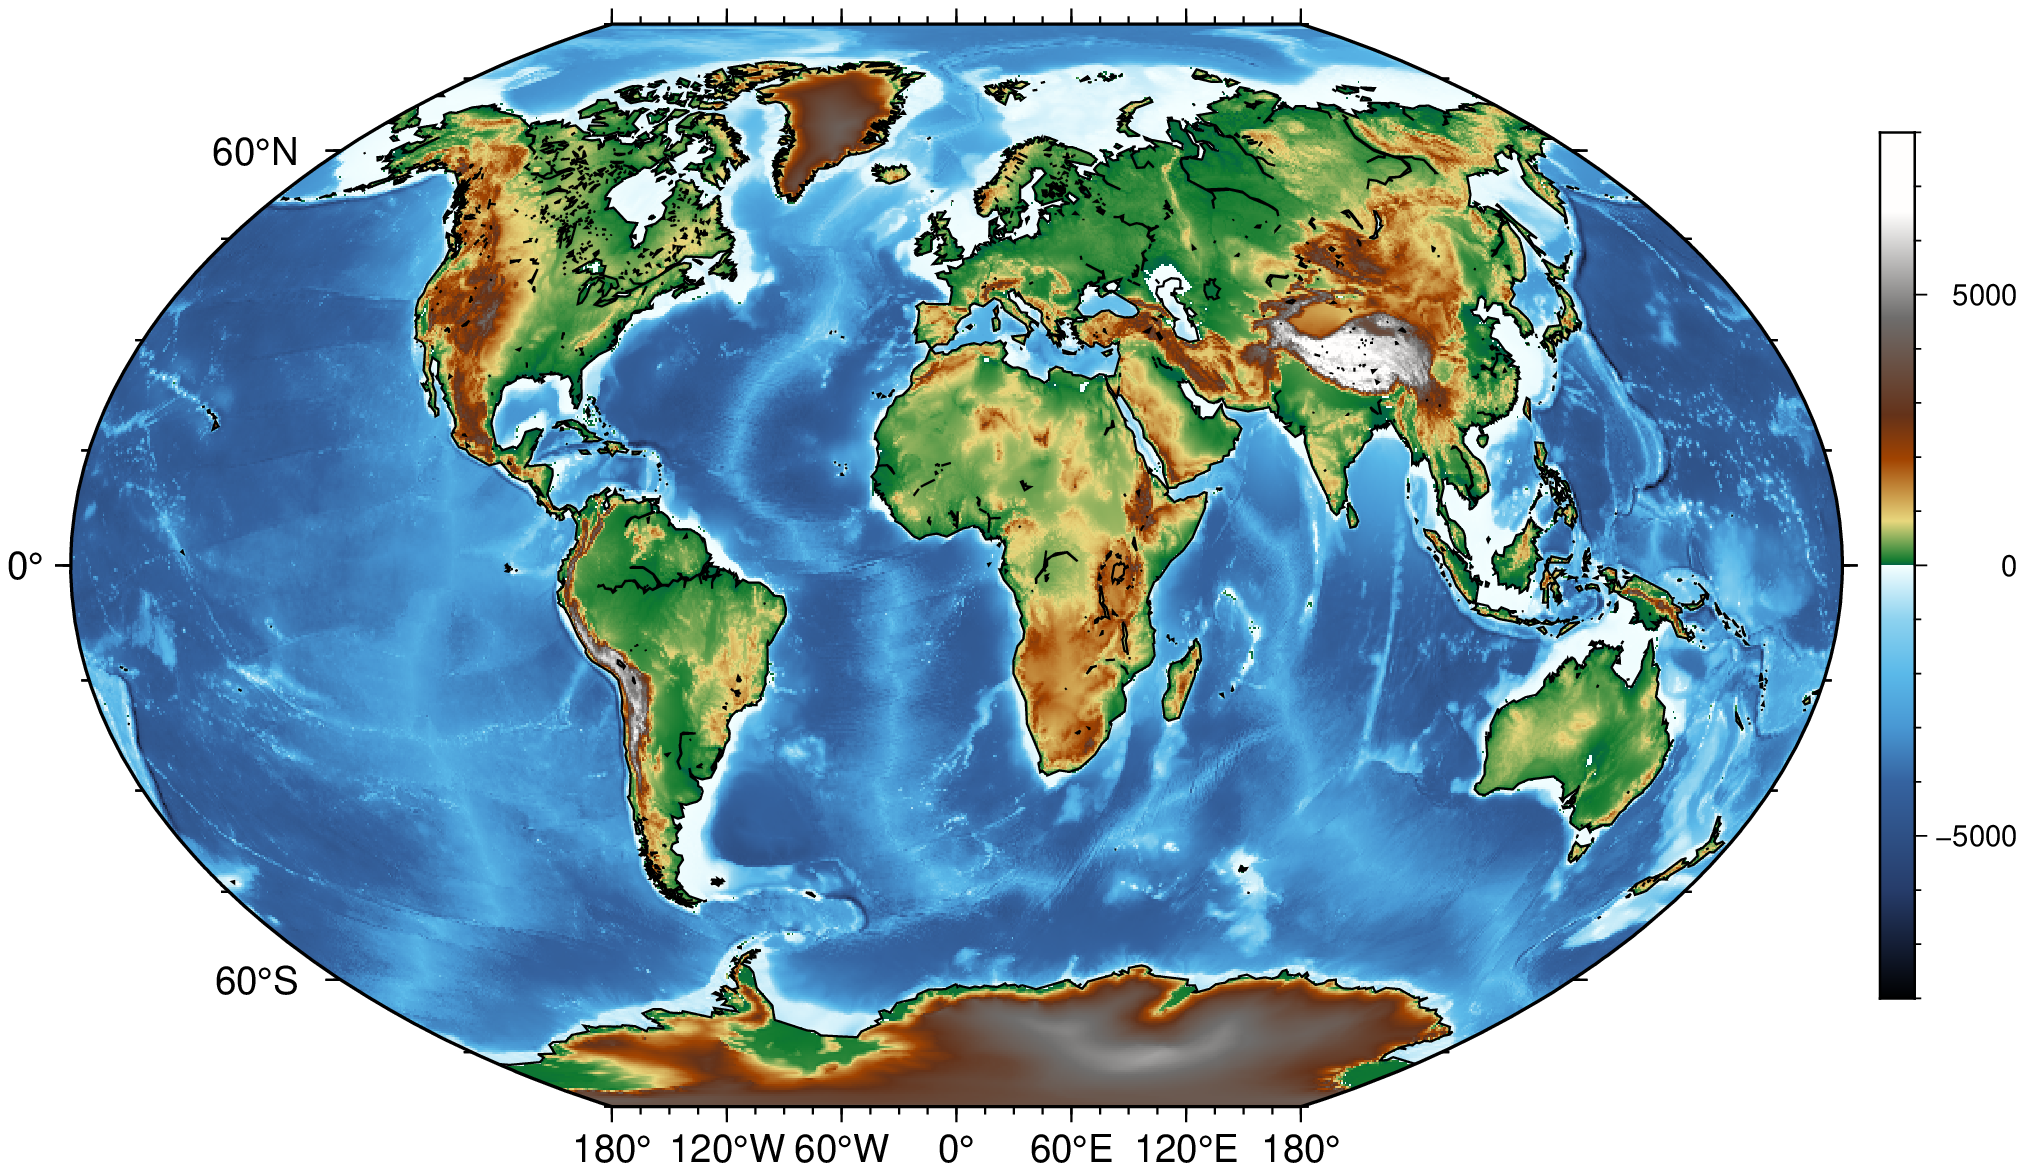
A global bathymetry
Make a map of the global bathymetry (automatically download it if needed) using the Winkel projection, add coast lines and a color bar
using GMT
grdimage("@earth_relief_20m_g", proj=:Winkel, colorbar=true, coast=true, show=true)
© GMT.jl. Last modified: October 03, 2023. Website built with Franklin.jl and the Julia programming language.
These docs were autogenerated using GMT: v1.33.1